Look and Feel
Layout
The user interface design and layout are kept simple and intuitive, ensuring ease of use for all users. It is responsive, adapting seamlessly to various devices used by the users.
Access to the platform is secured by user roles, username and password, ensuring the protection of sensitive information.
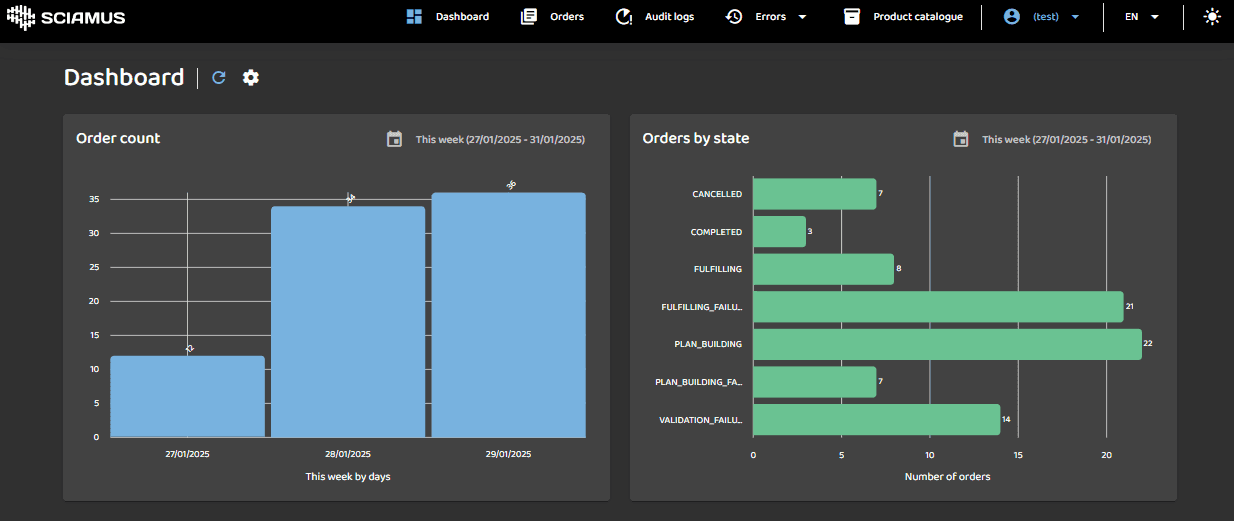
Upon logging in, users are directed to the application's default dashboard screen, offering a high-level summary of essential data regarding the orders being processed by the system. The top section of the screen features a navigation bar, granting access to the platform's main modules, while the bottom section displays data specific to the currently selected application module.
The platform's user interface is tailored to cater to system operators, system administrators and order flow specialist, ensuring that each user group can efficiently navigate and utilize the platform to fulfill their respective roles and responsibilities.
upon logging in.
Navigation bar
![]()
- Dashboard The customizable system dashboard presents default data regarding order count and orders by state within a specified day range, offering a high-level overview.
- Orders This section lists all orders within the system, offering comprehensive filtering, sorting, and date range options for efficient navigation and management.
- Audit Logs Users can access detailed audit logs outlining order processing activities within the system, with functionalities for filtering, sorting, and specifying date ranges to facilitate thorough monitoring and analysis.
- Errors In this submenu, users can view either the current (active) or historical order processing errors, equipped with filtering, sorting, and date range capabilities for effective troubleshooting and resolution.
- Product Catalogue This section presents imported and deployed product catalogue configurations, allowing users to upload and deploy new product catalog definitions.
- User Displays the username of the active user, with the option to safely logout from the system by clicking on the user icon.
- Language Displays currently chosen language, can change it by clicking on it.
- Theme Users can personalize their experience by selecting the application theme, choosing between light or dark mode to suit their preferences.
Dashboard
Main view
The application comes with a default dashboard displaying data on order count and orders by state within a specified day range. This dashboard can be fully customized as per customer requirements.
The gear button allows the user to configure auto refresh functionality. The refresh button allows the user to manually refresh on screen data.
Left Pane
Presents a bar chart showing the order count per date range.
Right Pane
Presents a bar chart showing the order count per fulfillment state.
The calendar buttons in the top right corner of the charts allow users to select one of the preset date ranges (Last 3 days, This week, Last 2 weeks, Last Month, This year, or All). The chart will automatically refresh after date range has been changed.
After clicking on a single bar on each chart, the user is guided to a detailed list of orders that constitute the bar. This list is part of the application's Orders module, described further below.
Orders
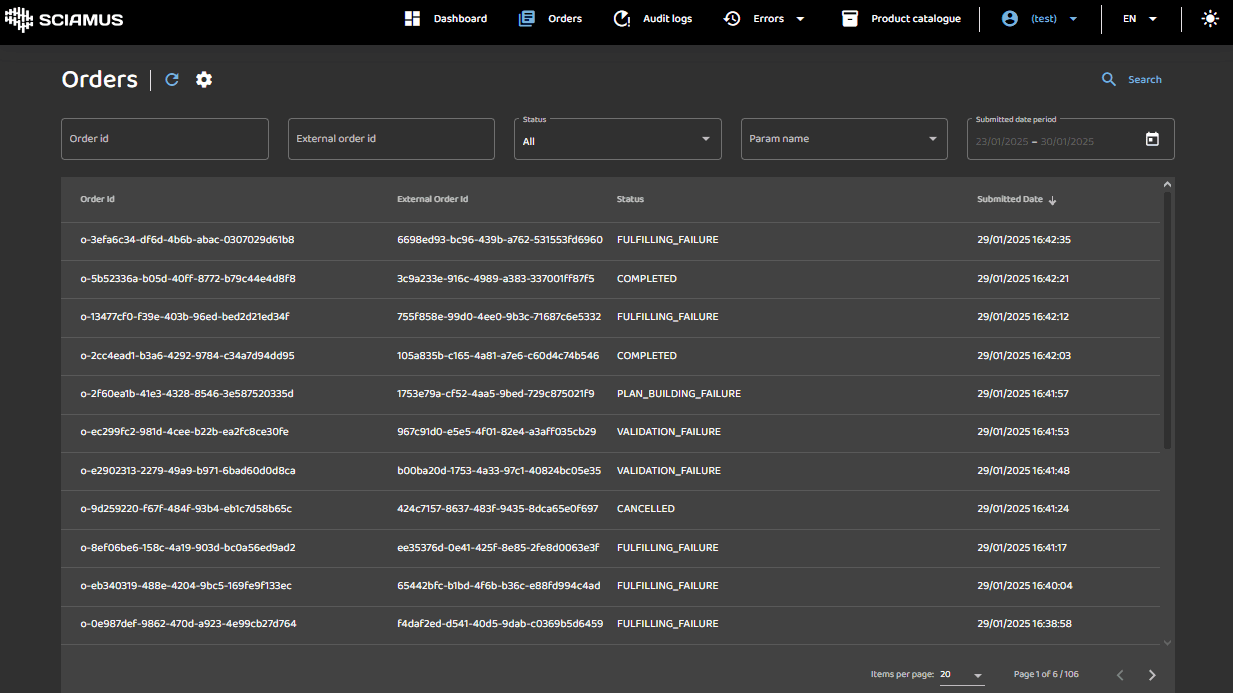
This view allows the user to browse all orders in the system irrespective of the order state. The user can search and filter the list by selected criteria.
Search Pane
The pane contains search and filter controls. Users can search and filter orders by typing data into the filter textboxes or selecting values from dropdown menus and the calendar widget. The following search criteria are supported: Order ID, External Order ID, Status, Submitted Date, and Order Parameters.
The search for orders matching criteria is initiated after clicking the Search button (magnifying glass icon).
The gear button allows the user to configure auto refresh functionality. The refresh button allows the user to manually refresh on screen data.
Results Table
The table header contains the column names. The table body shows all orders matching search criteria. The items on the list can be sorted in ascending (up arrow) or descending (down arrow) order by clicking table header.
Table footer contains standard pagination controls allowing selection of items per page and backward and forward page navigation.
After clicking on a single row of the results table, the user is guided to an order details screen described further below.
Order details

This view allows the user to review key information about particular order. User can see order execution graph, audit logs, review and amend order payload, see current and historical fulfillment errors. The view has three panes.
Header Pane
This read-only pane displays data from order header (order id, external order id, status, submitted date, and more). After clicking on the Cancel Order button located in the top right corner user can decide to cancel particular order. This action is only possible for order which fulfillment didn't complete. To return to the order list, the user can either click the Go Back to List button or press the ESC key.
In addition to the gear and refresh icons, the collapsible icon allows the user to hide the header pane to free up screen space.
Menu Pane
This menu allows the user to select relevant order details to review in the bottom details pane:
- Graph: Displays the order execution graph
- Audit Logs: Shows audit logs related to order execution
- Order Payload: Includes functionality to review and edit the order payload
- Current Error: Shows the current errors
- Error History: Shows the history of errors
Content Pane
This pane updates dynamically, based on the user's selection in the Menu Pane.
Graph
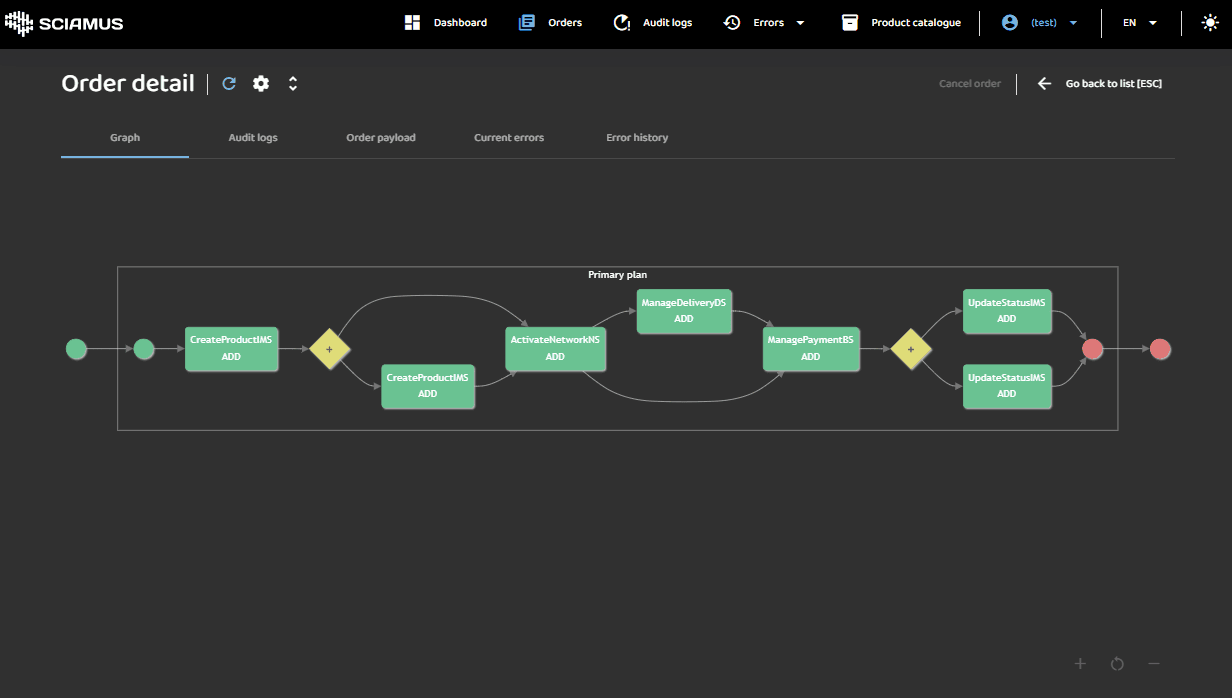
This view shows interactive graph of order execution, which is an instance of the plan generated from order payload and product catalogue definition. Each rectangle on the graph represents order execution step, line and arrows show the control and synchronization paths true order fulfillment. Diamonds on the graph represent non-executable splits and synchronization points to enhance diagram clarity in the case of complex execution plans.
User can Zoom In and Out areas of the graph as well us scroll using mouse gestures. To see the complete graph Zoom Reset functionality is provided.
Graph notation uses rectangle colors to represent various states of step execution:
- Green - step execution COMPLETED successfully.
- Blue - step EXECUTION is ongoing at the moment.
- Gray - step is WAITING and will be executed after its dependent steps are completed
- Red - step execution ended in ERROR.
- Black - step execution ABANDONED due to ongoing compensation plan generation.
Interactive Features
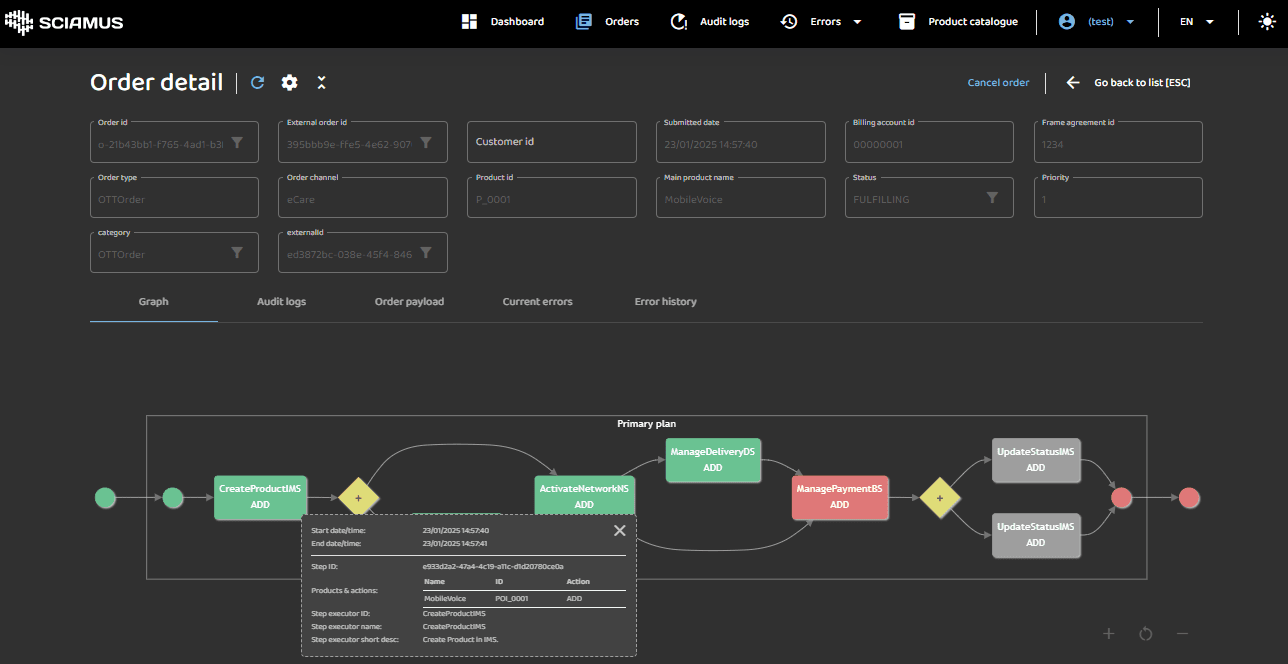
Left-clicking on a step (rectangle) opens a popup displaying detailed execution information.
- The displayed details can be modified or extended. More information is available here - FIX ME TBD TO DO TODO.
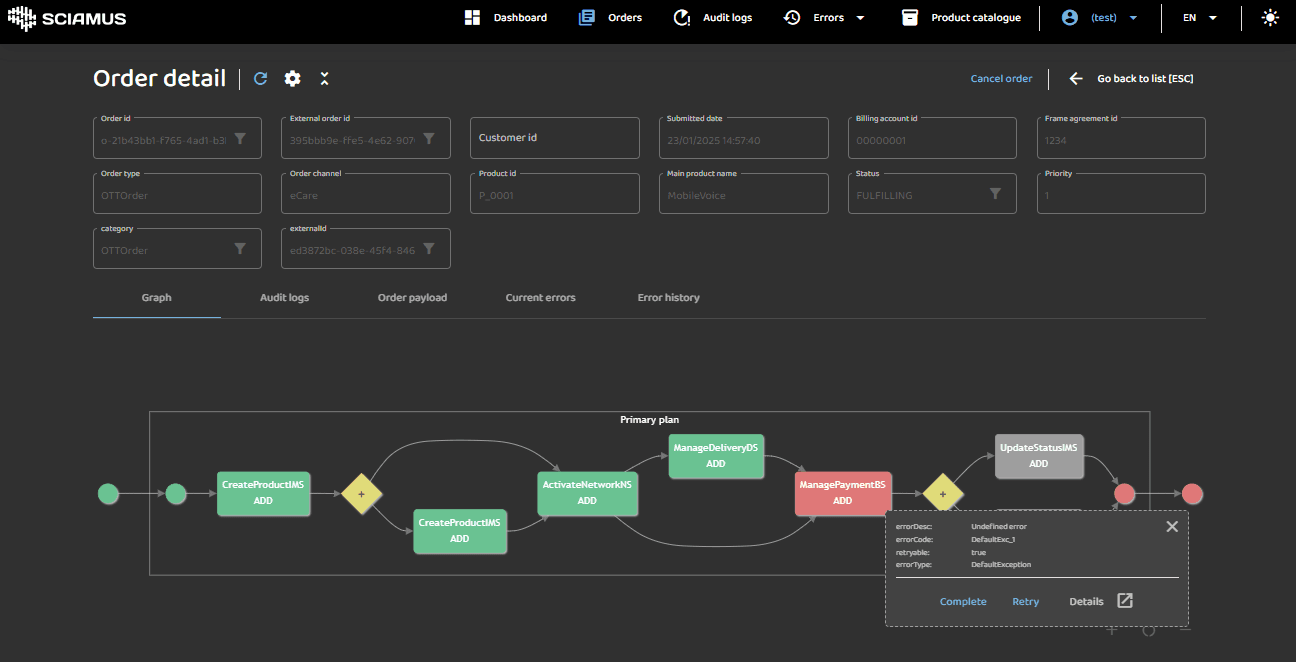
Right-clicking on a step with an ERROR (red) or EXECUTION (blue) status opens a context menu with the following options:
- Complete – Skips the step and marks it as completed.
- Retry – Retries execution of the step.
- Details – Navigates directly to the error details.
Audit Logs
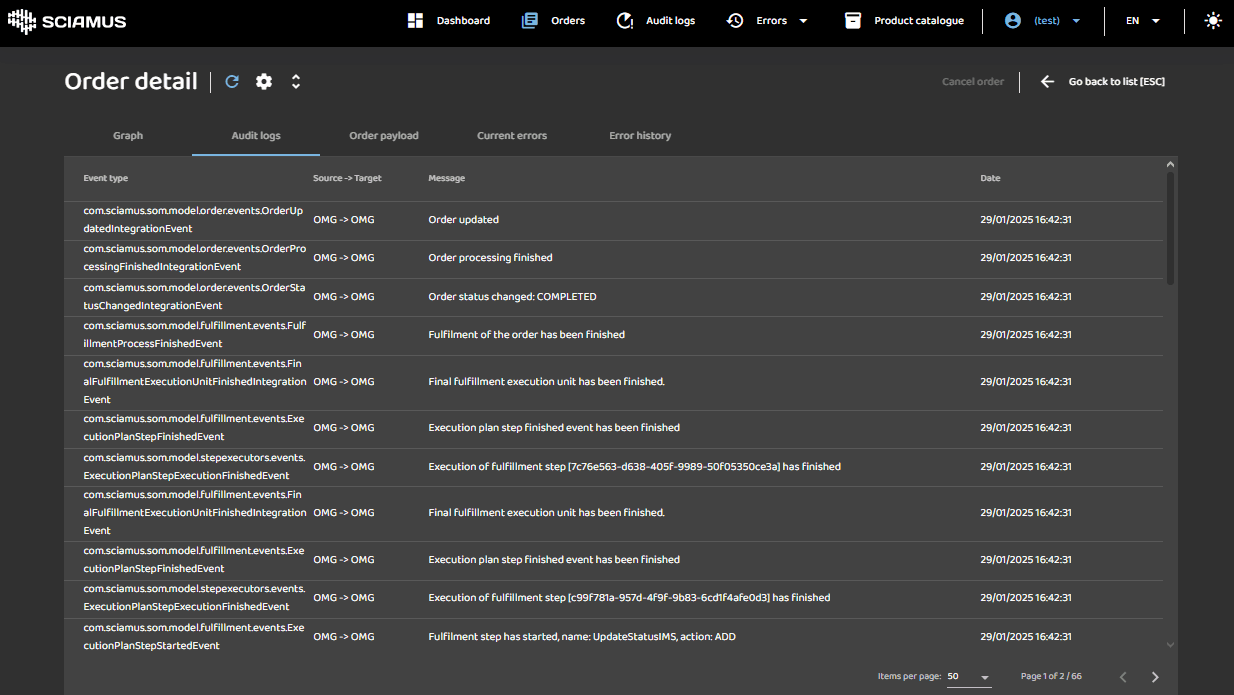
This view provides a read-only preview of each audit entry for the order. The table header displays the column names, while the table body shows all events for a particular order. The items in the list can be sorted in ascending order (up arrow) or descending order (down arrow) by clicking on the table header.
Audit entries contain vital information about the fulfillment path, actions executed by the system, and their results.
By clicking on a specific table item, the user is presented with an event details popup that includes the full event payload.
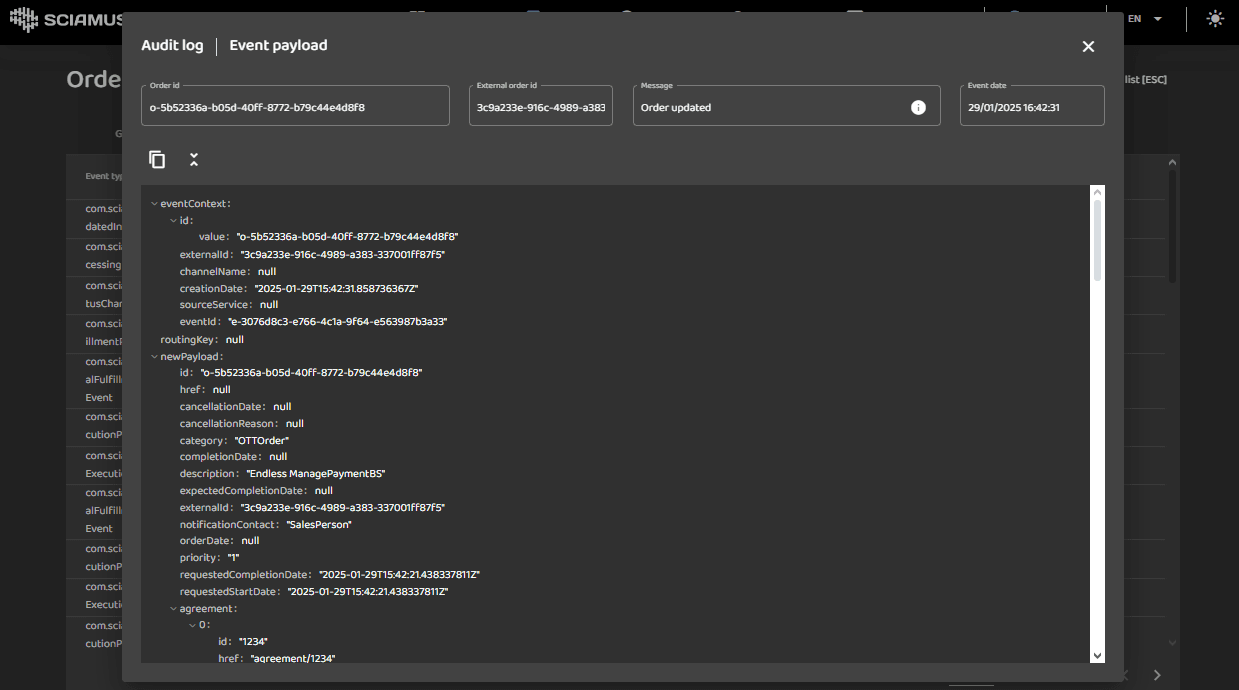
The payload can be copied to the user clipboard, collapsed or expanded using popup toolbox icons.
External communication Audit Logs
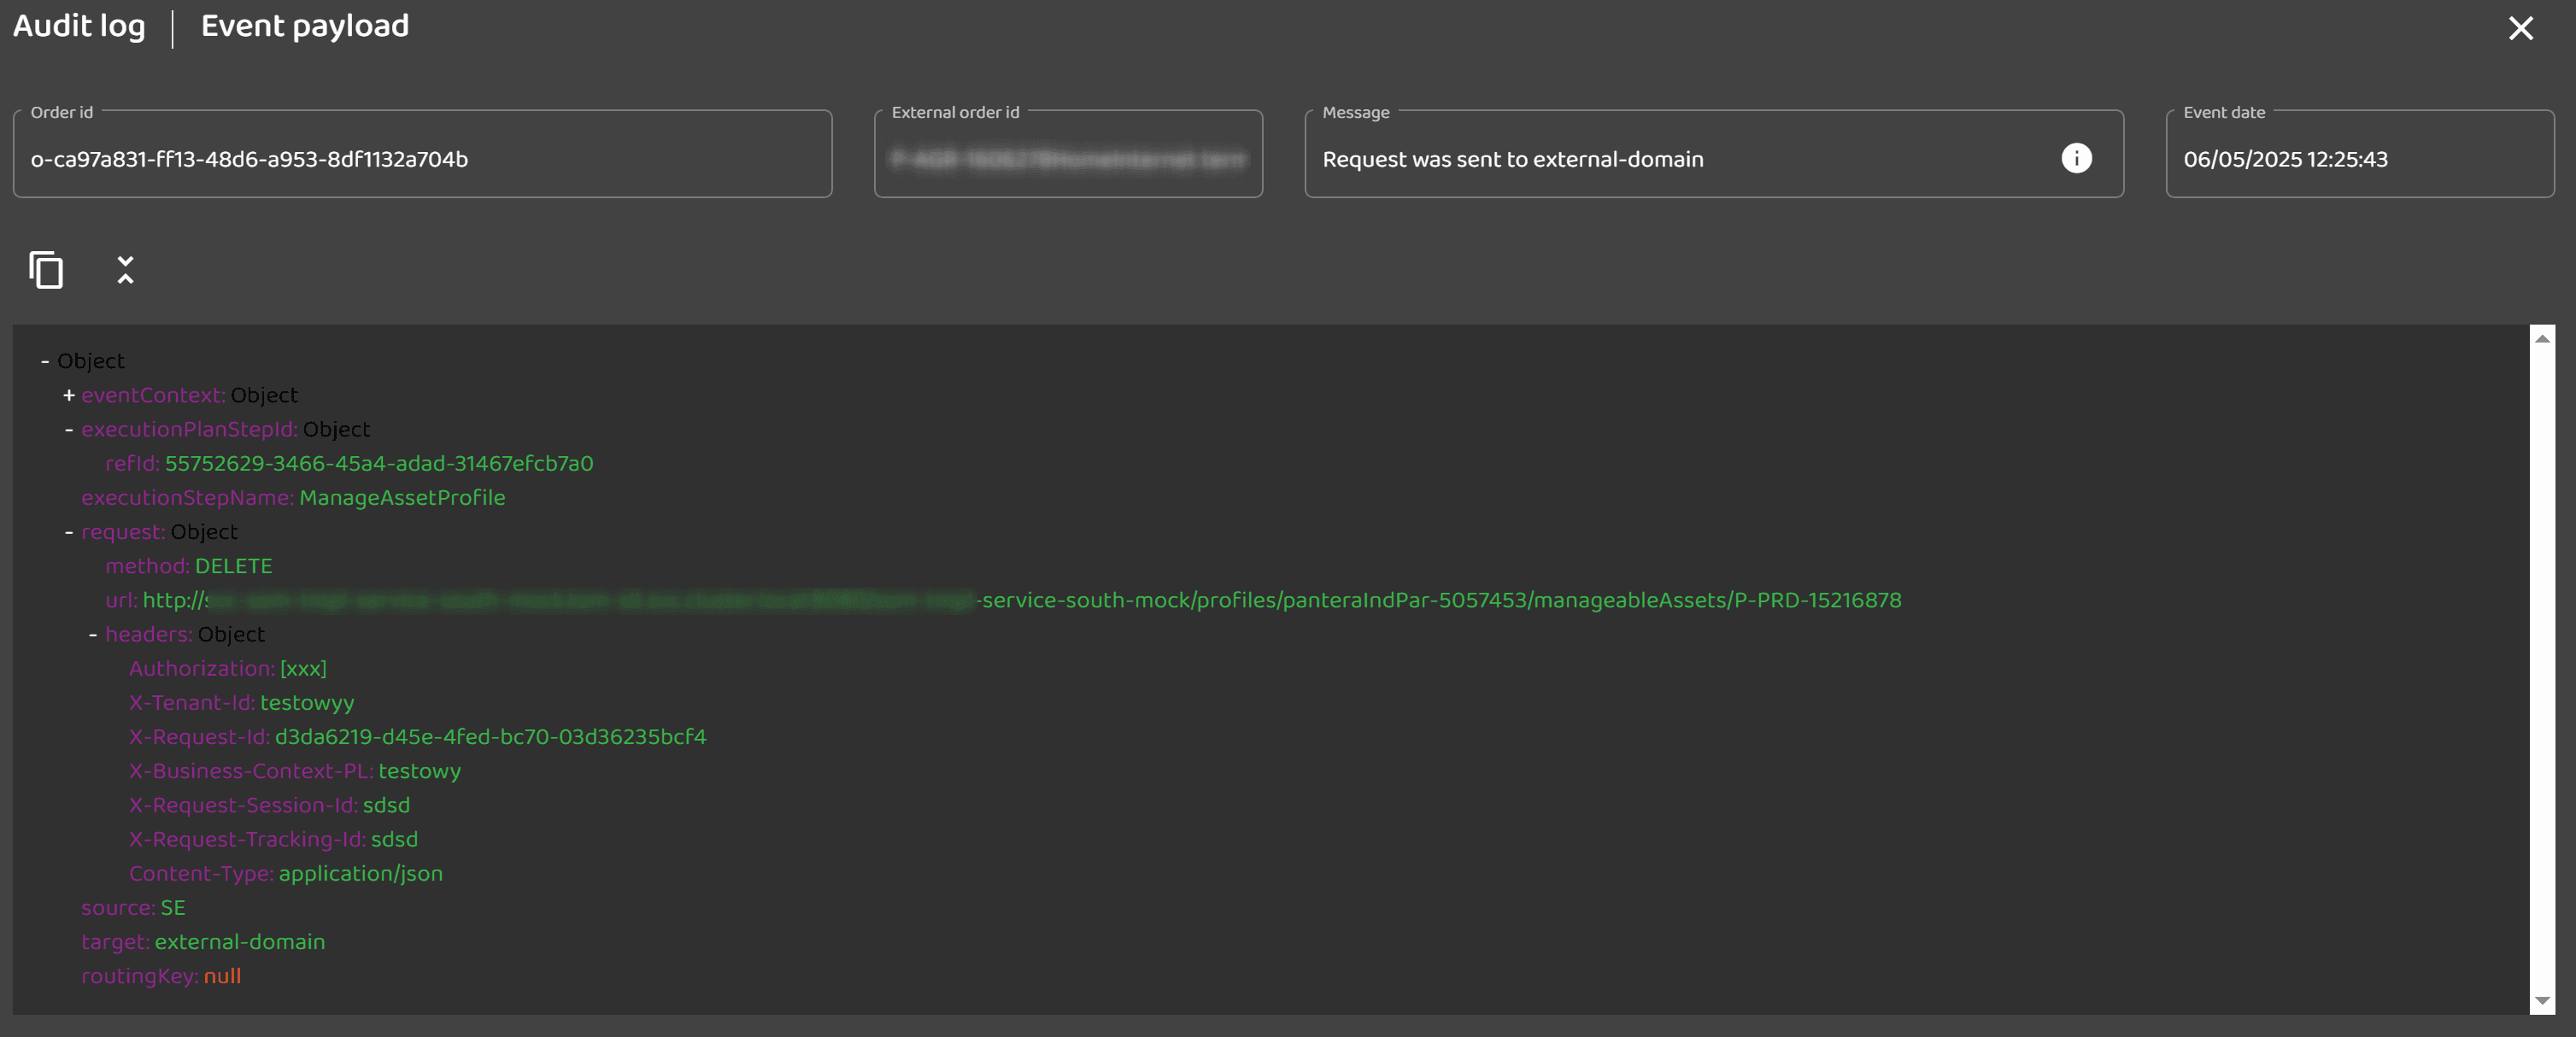
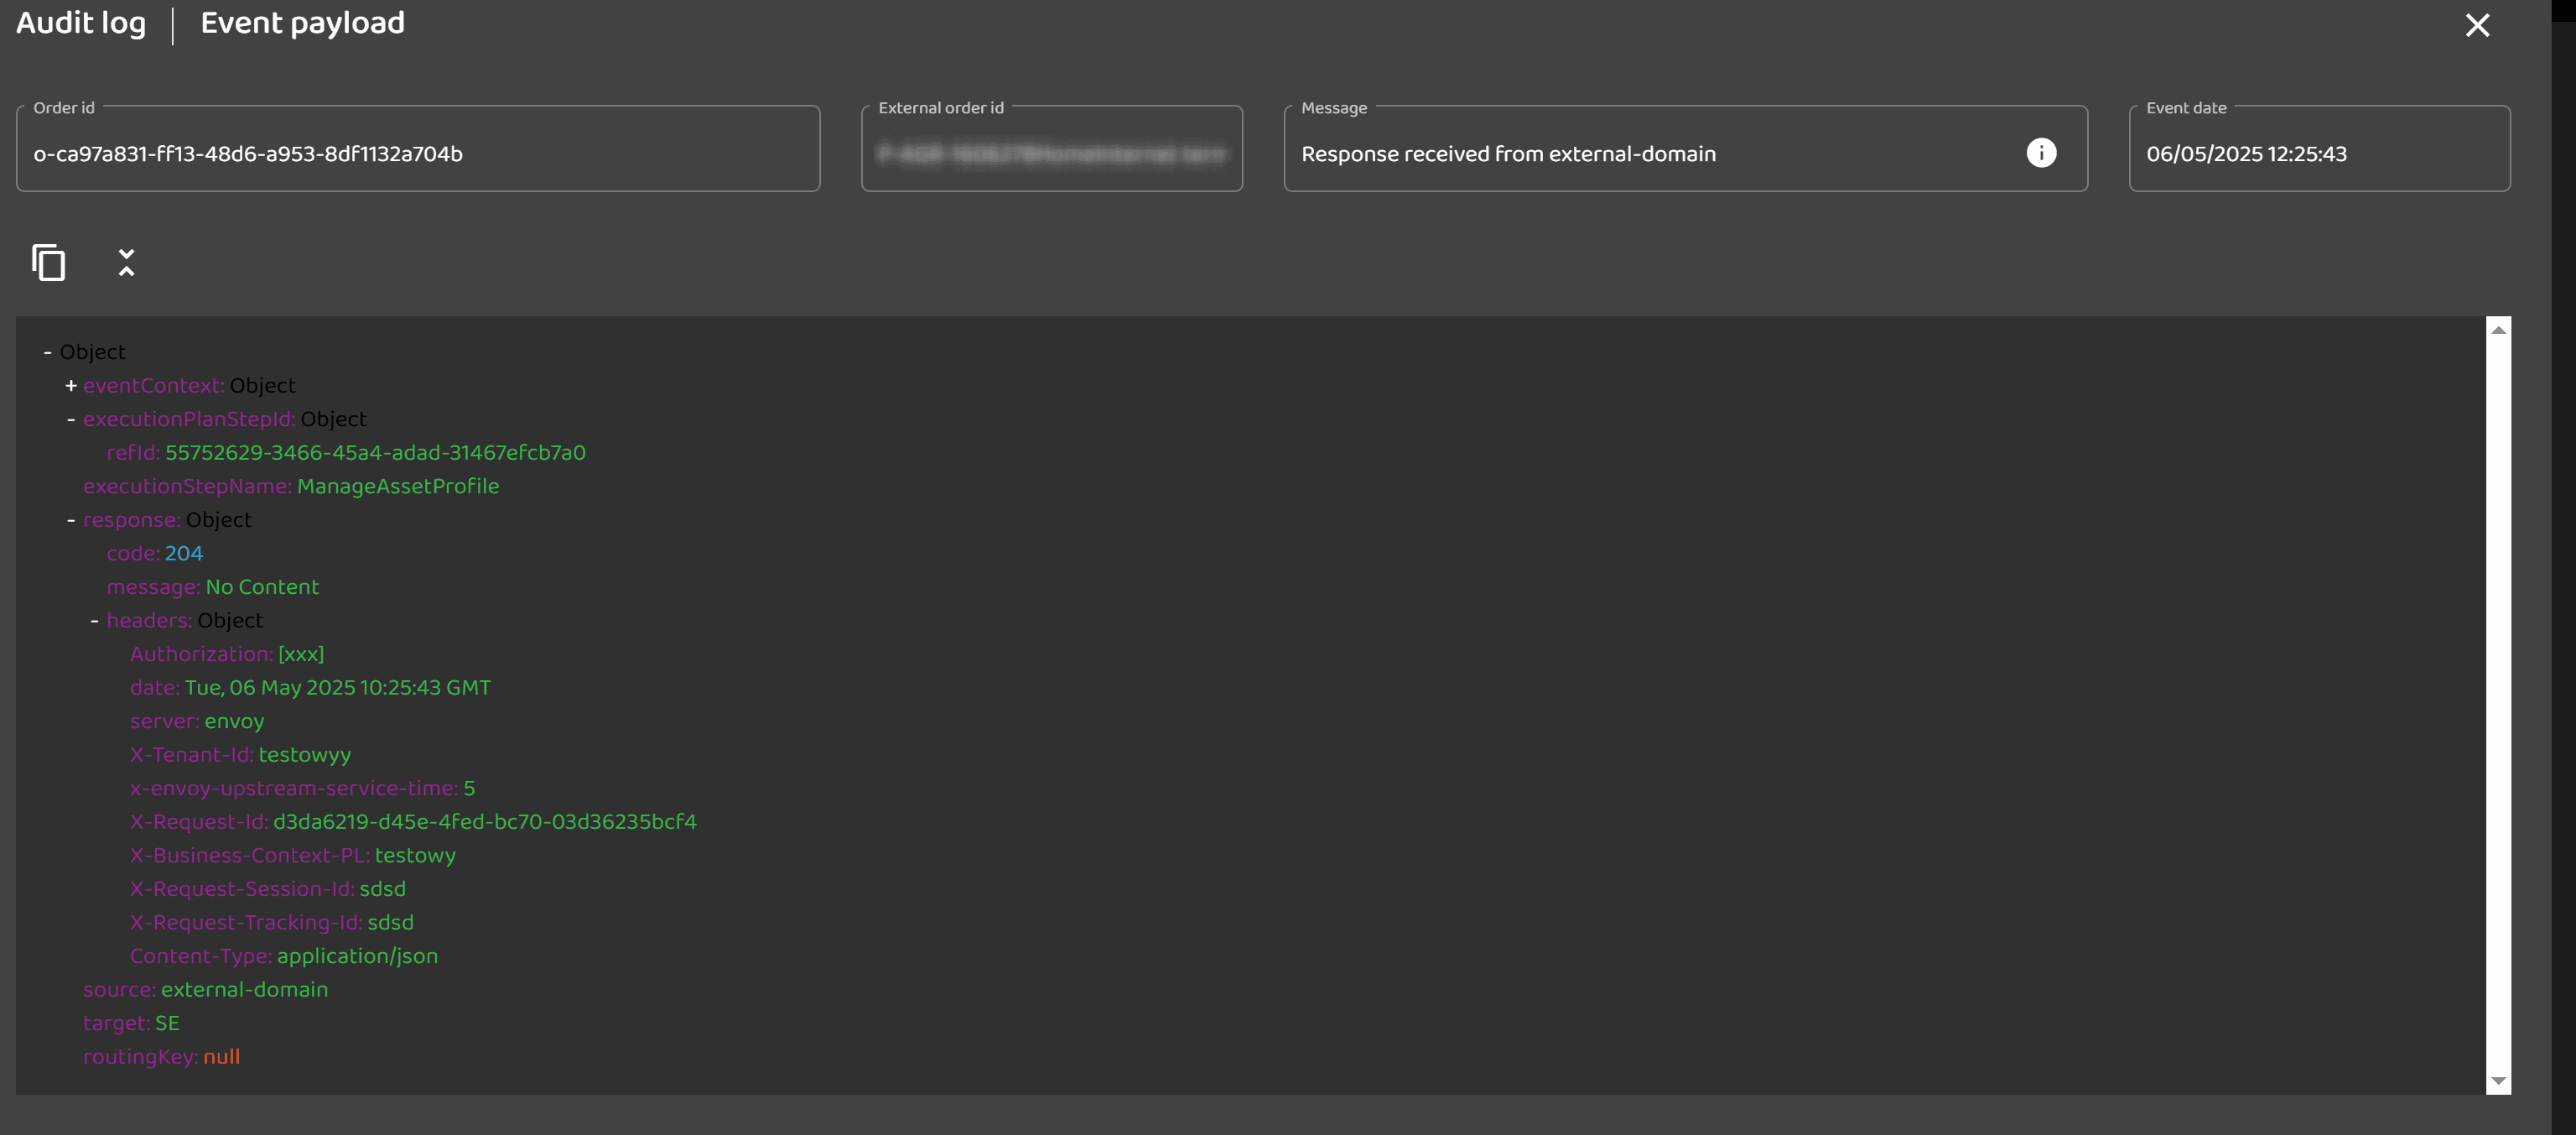
During Step Executor execution, the system may communicate with external systems. It's a good practice to log this communication in the audit logs. The following integration events are used:
- com.sciamus.som.model.stepexecutors.events.RequestSentToSouthIntegrationEvent
- com.sciamus.som.model.stepexecutors.events.ResponseReceivedFromSouthIntegrationEvent
Example of async communication during SE execution:
The details of the request and response are logged in the audit log. The request and response payloads are also included in the event payload.
Sample HTTP Request [Sync]:
Sample HTTP Response [Sync]:
Order Payload
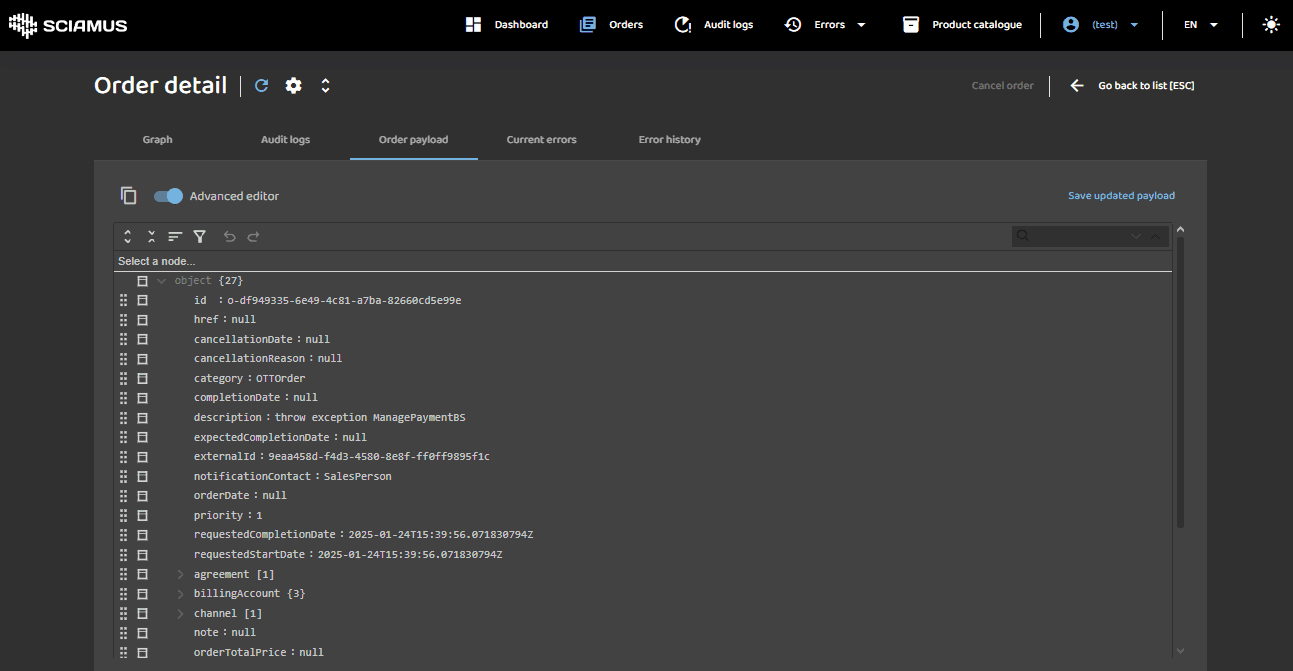
Advanced editor:
Simple editor:
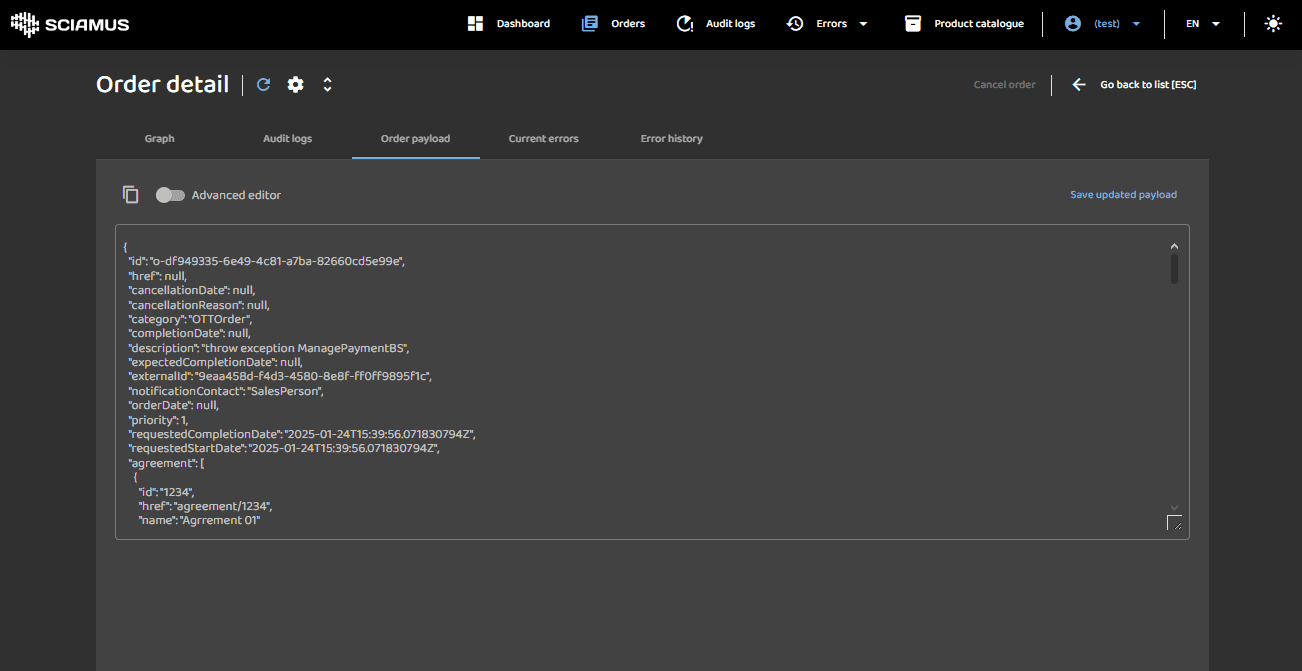
This view allows authorized users to review and edit order payload. The view provides convenient payload syntax highting editor or for advanced users plain text editor. To change between editors use the popup toolbox radio button Advanced. The payload can be copied to user clipboard using popup toolbox rectangle icon.
The syntax-highlighting editor includes the following features:
- Collapsing and expanding sections of the payload
- JMESPath Query: Enables filtering, sorting, or transforming JSON data
- Full-text search with highlighted search occurrences
To learn more about JMESPath, follow the interactive tutorial.
After completing the payload editing session, the user can save the changes by clicking Save Updated Payload.
Additional functionality includes a quick revert and reapply changes feature for ease of use.
Current Errors
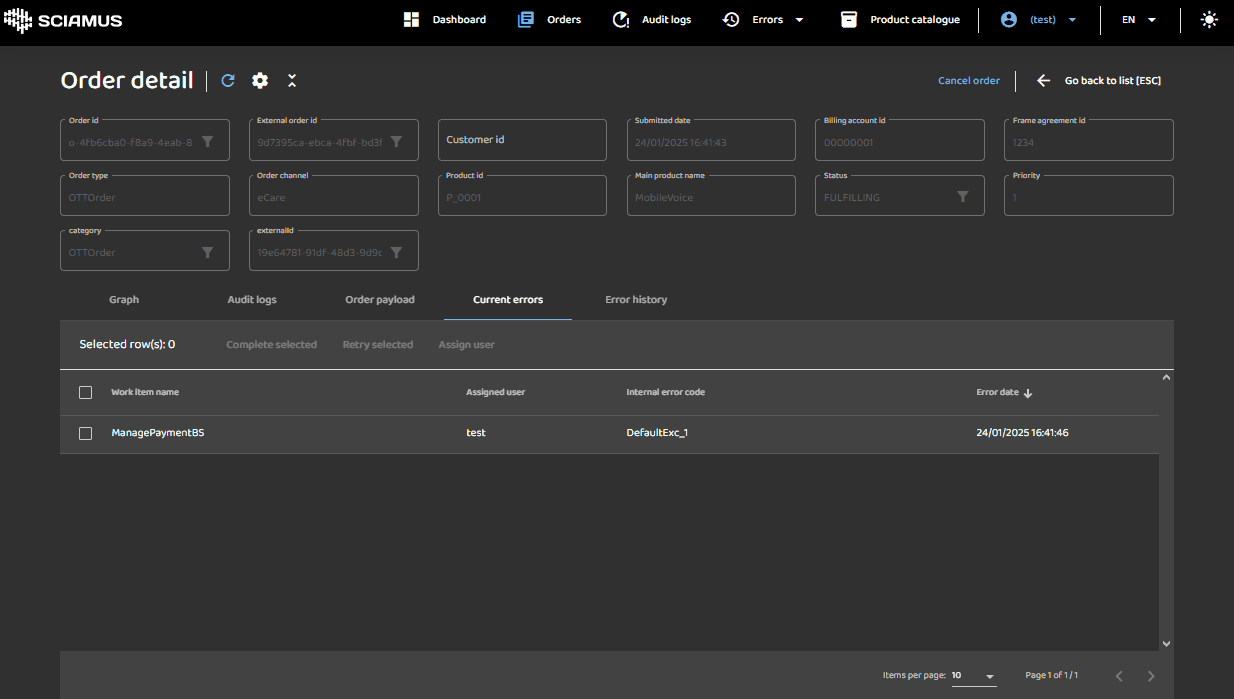
This view allows authorized users to review and manage fulfillment errors for particular order. The table header holds column names. The table body shows all active errors for particular order. Items in the list can be sorted in ascending order (up arrow) or descending order (down arrow) by clicking on the table header.
User can select single or multiple items from the list, by using checkboxes in the left column or Select All checkbox located in the table toolbox pane. Selecting item activates error remedy action buttons in toolbox pane.
Remedy actions include:
- Complete selected - marks steps as completed assuming error was fixed manualy
- Retry selected - marks steps to be retried by the engine.
- Assign user - assigns a specific user to further investigate the error.
Please note remedy actions allow for one or many steps at a time to be "fixed".
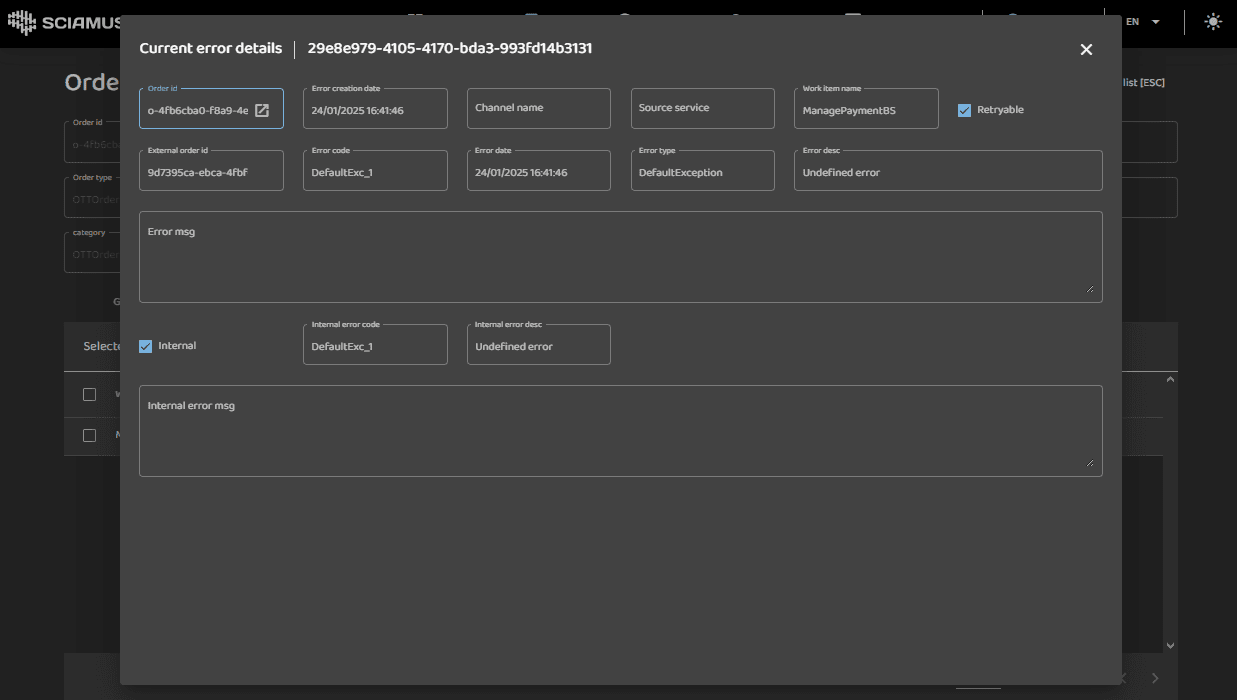
By clicking on a specific table item, the user is presented with an error details popup, which includes the full event payload.
Error History
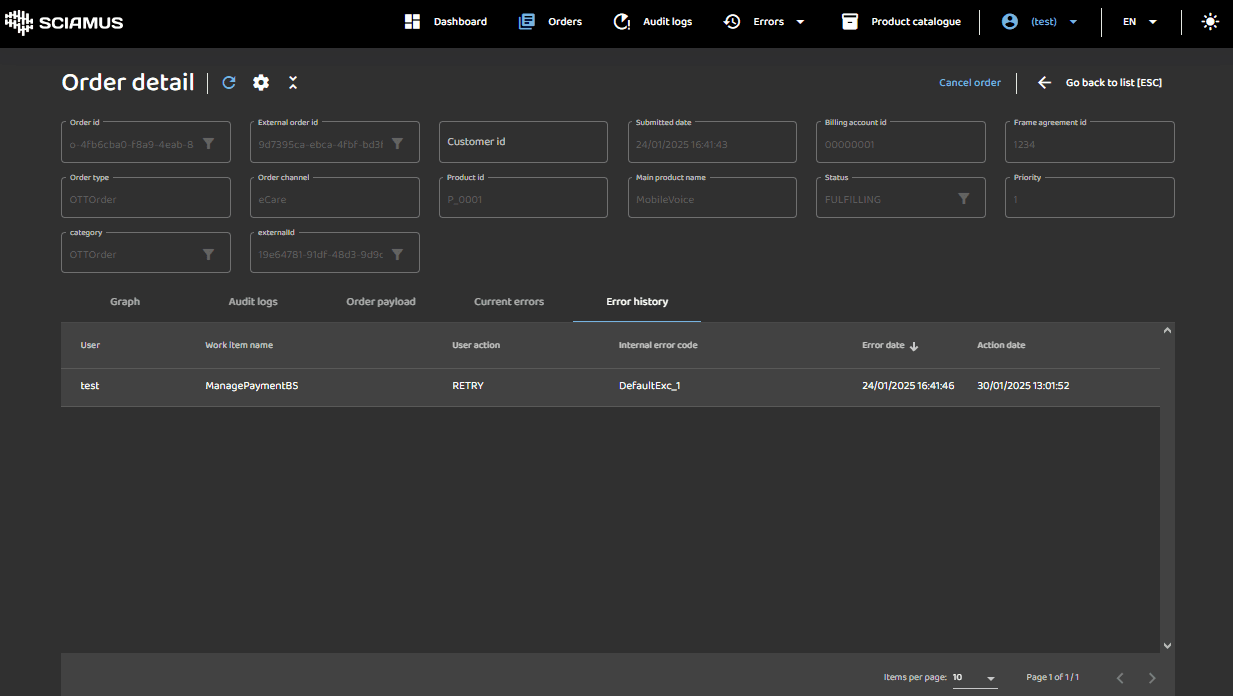
This view allows authorized users review historical fulfillment errors for particular order. The table header holds column names. The table body shows all historical errors for particular order. Items in the list can be sorted in ascending order (up arrow) or descending order (down arrow) by clicking on the table header.
This feature provides a convenient way to understand the order's execution history and supports the analysis of complex order issues.
Global Audit Logs
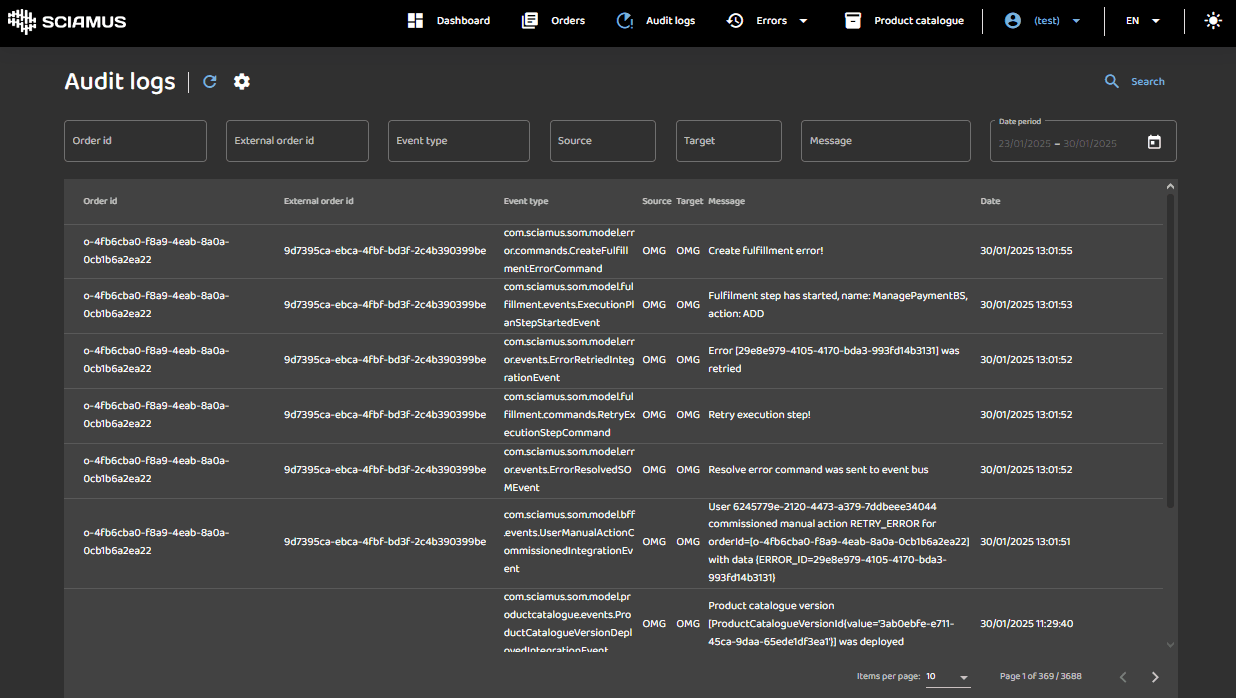
This view allows user to browse all audit evens in the system. User can search and filter the list by selected criteria. The audit entries hold vital information about the fulfillment path and actions executed by the system and their results.
Search Pane
The pane contains search and filter controls. Users can search and filter the events by typing data into the filtering textboxes or by selecting values from dropdowns and the calendar widget. Following filtering criteria are supported order id, external order id, event type, message and date range.
The search for events matching criteria is initiated after clicking the Search button (magnifying glass).
- The gear icon allows user to configure auto-refresh functionality.
- The refresh icon allows user to manually refresh on screen data.
Results Table
The table header holds column names. The table body shows all orders matching search criteria. Items in the list can be sorted in ascending (up arrow) or descending (down arrow) order by clicking on the table header.
The table footer contains standard pagination controls, enabling users to select the number of items per page and navigate between pages.
By clicking on a specific table item, users are presented with an event details popup that includes the full event payload. The payload can be copied to the user's clipboard, collapsed, or expanded using the popup toolbox icons.
Sample of manual action events
Below are examples of events logged by the system when a user manually performs an action. When such an action is triggered via the GUI, a command is sent to the backend. As the engine begins processing the command, a UserManualActionCommissionedIntegrationEvent is emitted.
An event logged when a user manually cancels an order:

An event logged when a process step is manually force-finished:

An event logged when an error on a step is manually retried:

Errors
Current Errors
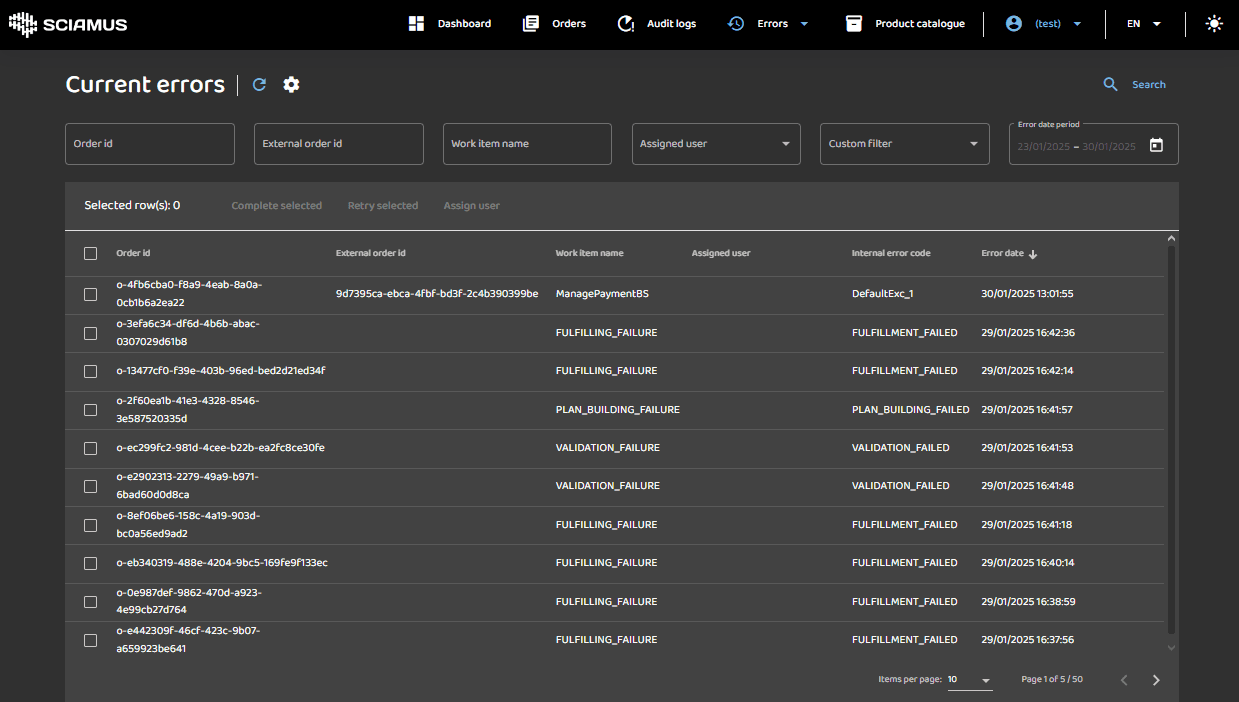
This view allows authorized users to review and act on all fulfillment errors irrespective to particular order.
Search Pane
The pane contains search and filter controls. Users can search and filter errors by typing data into the filtering textboxes or by selecting values from dropdowns and the calendar widget. The following filtering criteria are supported: order ID, external order ID, work-item name, assigned user, and date range.
The search for error matching criteria is initiated after clicking the Search button.
- The gears icon allows user to configure auto refresh functionality.
- The arrow loop icon allows user to manually refresh on screen data.
Results Table
In this pane, the table header displays column names, while the table body showcases all error that match the search criteria. Users can sort the items in ascending (up arrow) or descending (down arrow) order by clicking on the table header.
The table footer contains standard pagination controls, enabling users to select the number of items per page and navigate backward and forward through the pages.
Upon clicking on a specific table item, users are presented with an error details popup, which includes the full event payload. Within the popup, users can copy the payload to their clipboard and collapse or expand it using the icons in the popup toolbox.
Users have the option to select single or multiple items from the list using checkboxes in the left column or the Select All checkbox located in the table toolbox pane. Selecting an item activates error remedy action buttons in the toolbox pane.
Remedy actions include:
- Complete selected - Marking steps as completed, assuming the error was fixed in the external system.
- Retry selected - selected Marking steps to be retried by the engine.
- Assign user - Assigning a particular user to further investigate the error.
It's important to note that remedy actions allow for one or many errors to be "fixed" at a time.
Error History
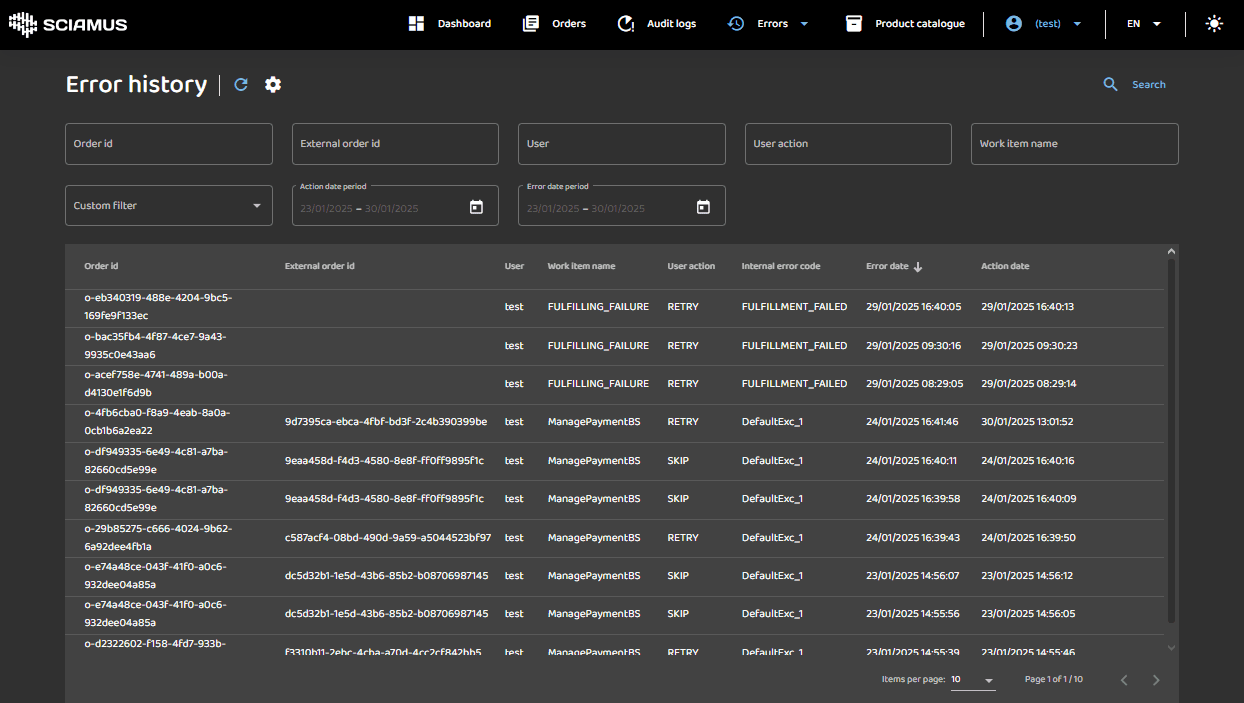
This view enables authorized users to review all historical fulfillment errors, regardless of a specific order. The table header displays column names, while the table body presents all historical errors in the system. Users can sort the items in ascending (up arrow) or descending (down arrow) order by clicking on the table header. Filtering options include order ID, external order ID, work-item name, assigned user, and date range.
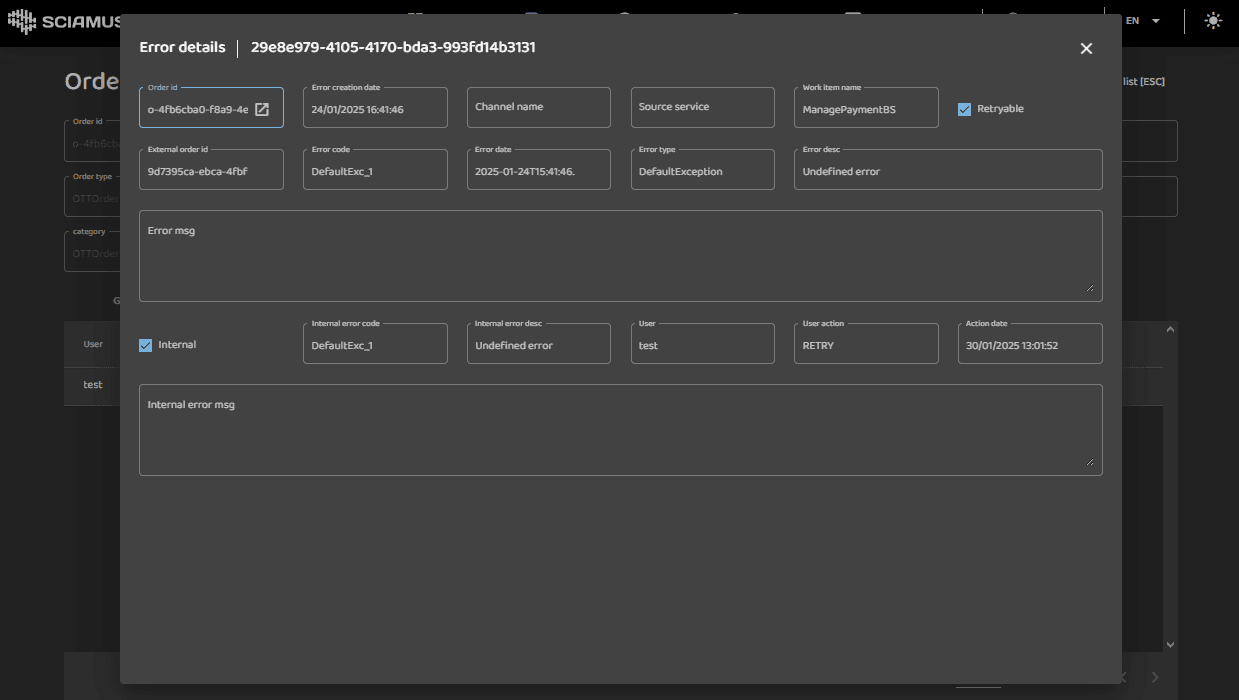
Upon clicking on a specific table item, users are presented with an error details popup containing the full error payload, providing comprehensive information about the incident.
Product Catalogue
Hot Deployment
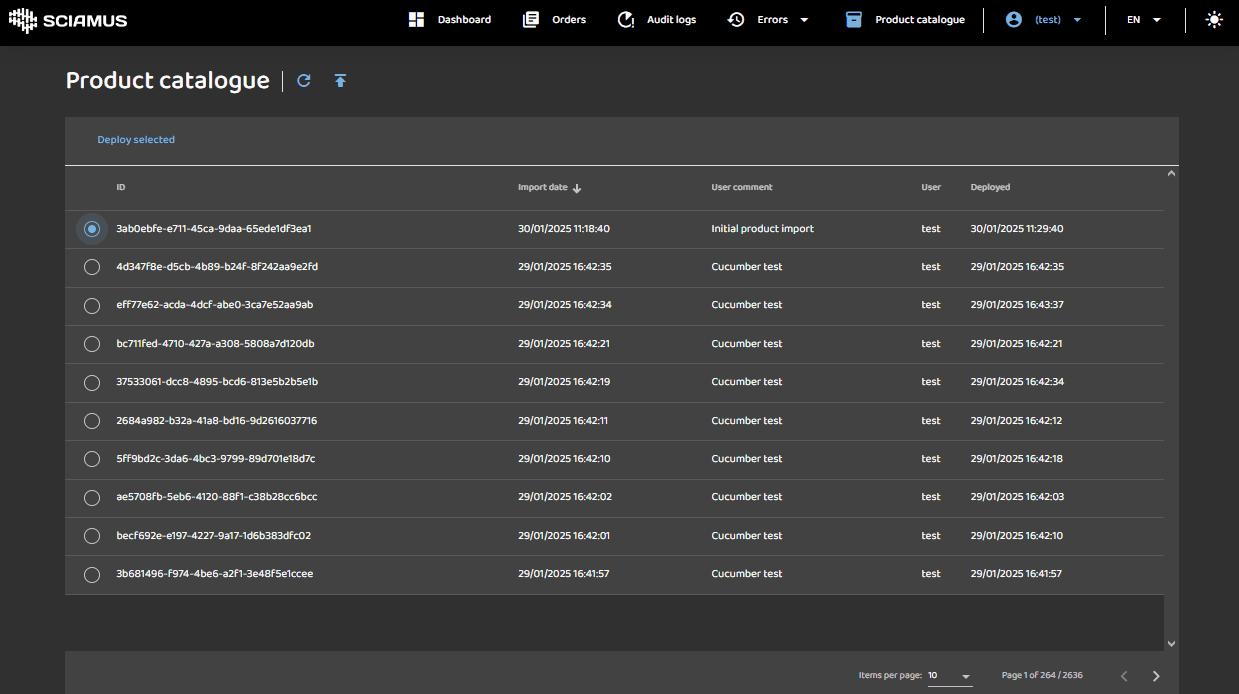
This view enables authorized users to import and deploy both new and previous versions of the product catalogue definitions. The table header displays column names, while the table body showcases each imported product catalogue definition. Users can sort items in ascending (up arrow) or descending (down arrow) order by clicking on the column names in the table header.
Once a particular product catalogue definition is selected, users can deploy it by clicking on Deploy selected.
Notably, the deployment of the product catalogue does not necessitate a system restart; it is effective immediately through hot deployment. In real-time, the system begins processing newly incoming orders based on the new catalogue definition, while ongoing orders adhere to the catalogue version used during order plan build.
Furthermore, clicking on the upload icon (up arrow) in the table toolbox prompts a popup, allowing users to import a new catalogue definition.
Import
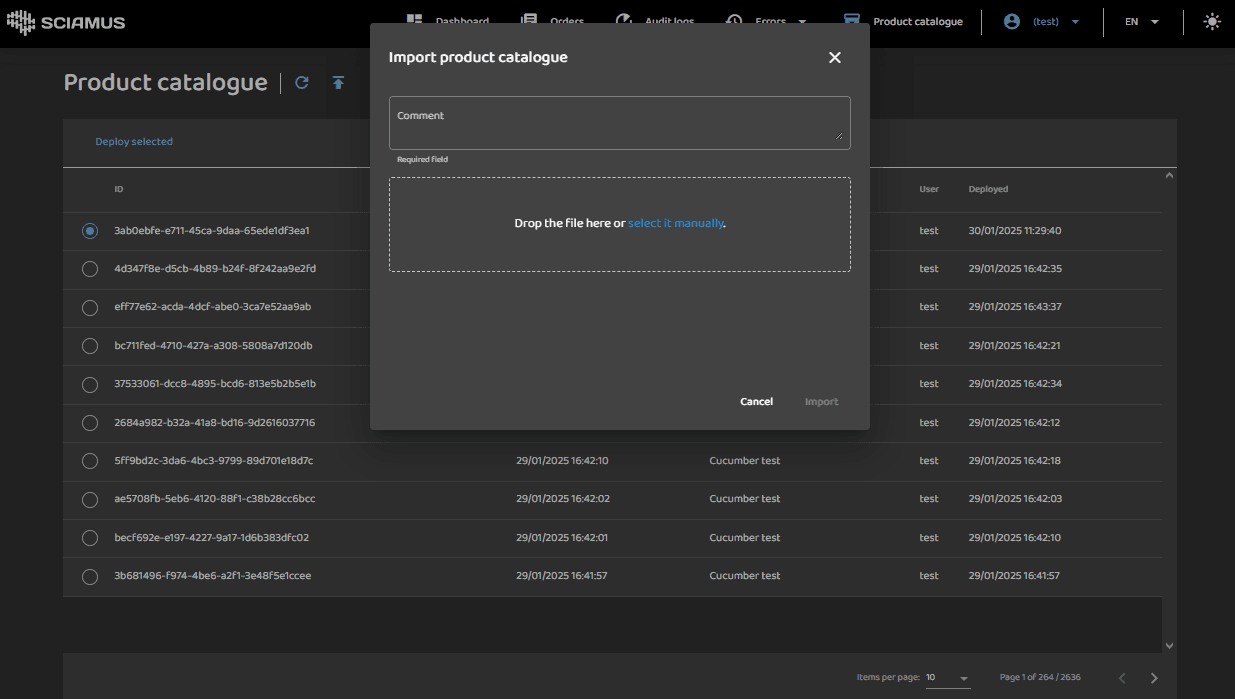
This feature enables authorized users to upload XLSX or CSV files containing the product catalogue definition. Files can be dropped into the popup window or selected from the workstation's file system by clicking on the highlighted hyperlink. It's beneficial to include a comment describing what this version of the product catalogue entails. However, as evidenced by the screens, our own team does not always adhere to this best practice.
Personalization in data views
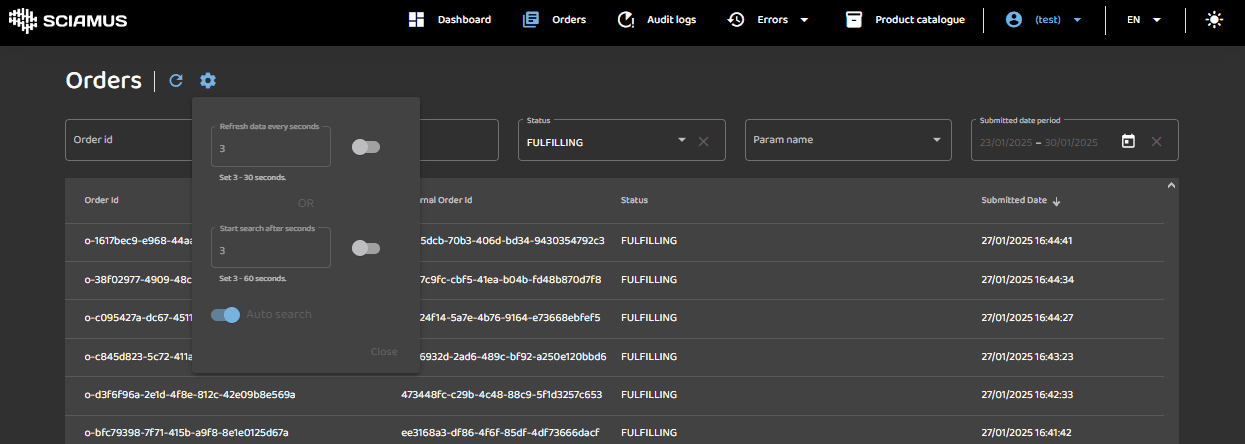
This feature enables configuring personal settings for all data views (Orders, Audit Logs, Errors). Users can configure automatic data refresh or enable automatic searching without the need to click on the Search button.

