AntiFragile
Overview
The purpose of the tests was to evaluate the system’ response to various failure scenarios and ability to restore full operation after an incident.
Various problems can occur during system operation, we limited ourselves to those which are most representative:
- Sudden stoppage of a step-executor (non-core connector service to external system) for 1 minute
- Planned stoppage of a step-executor
- Three sudden stoppages and consecutive shutdown of a step-executor
- Stopping and restoring RabbitMQ operation
- Stopping and restoring MongoDB operation
- Simulation of node (EC2) failure in an EKS cluster
For test environment spec please refere to performance test page
Results
- System handled failures with minimal disruptions
- Commands and orders were mostly processed after restoring services
- Errors due to unavailability were typical and recoverable
- Auto-scaling effectively managed node failures
Meat & Bones
Step-executor failure
Overview
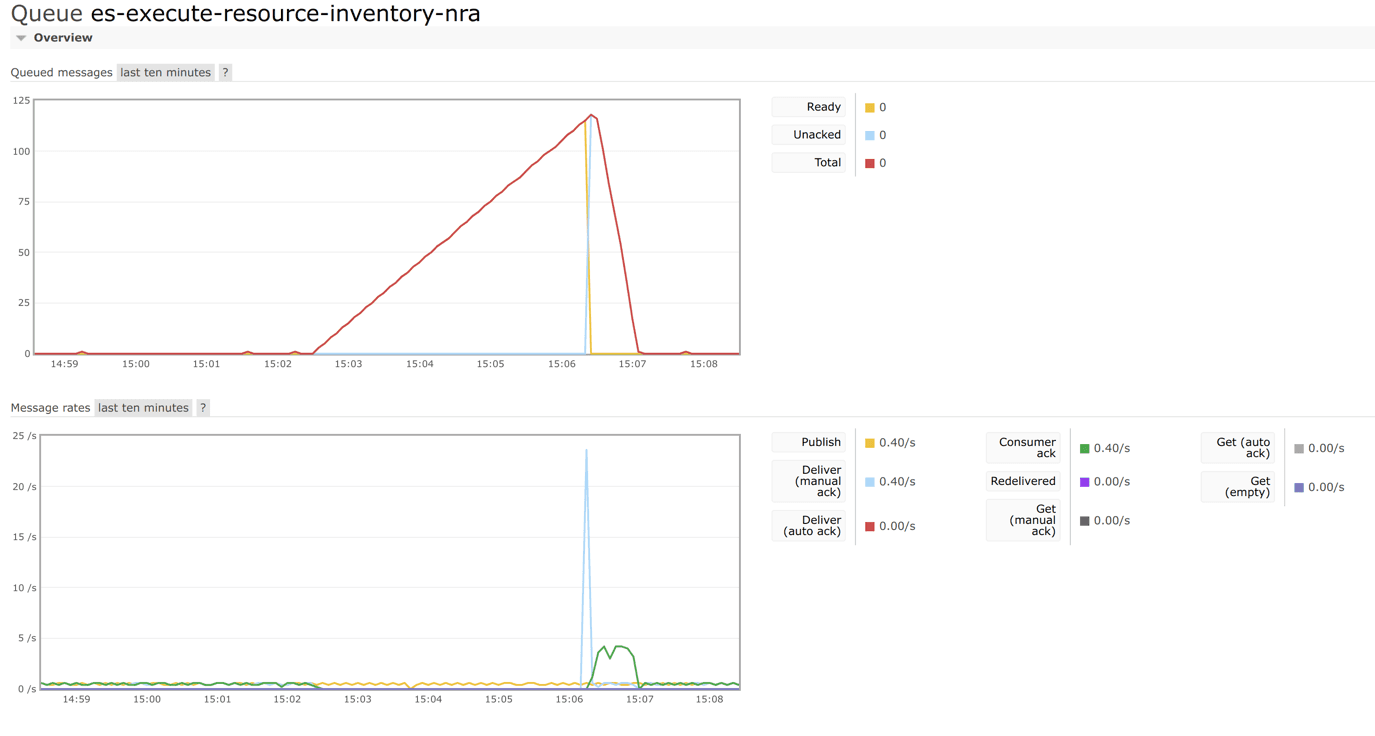
Sudden stoppage (kill) of the step-executor (kubectl delete -now) for 1 minute (from 15:02:30 to 15:05:07), restart at 15:06:20.
Purpose
Simulation of system behavior when one service stops functioning and cannot restart.
Result
No disruptions occured in system operation, except for delays in relevant execution steps due to the unavailability of the step-executor service.
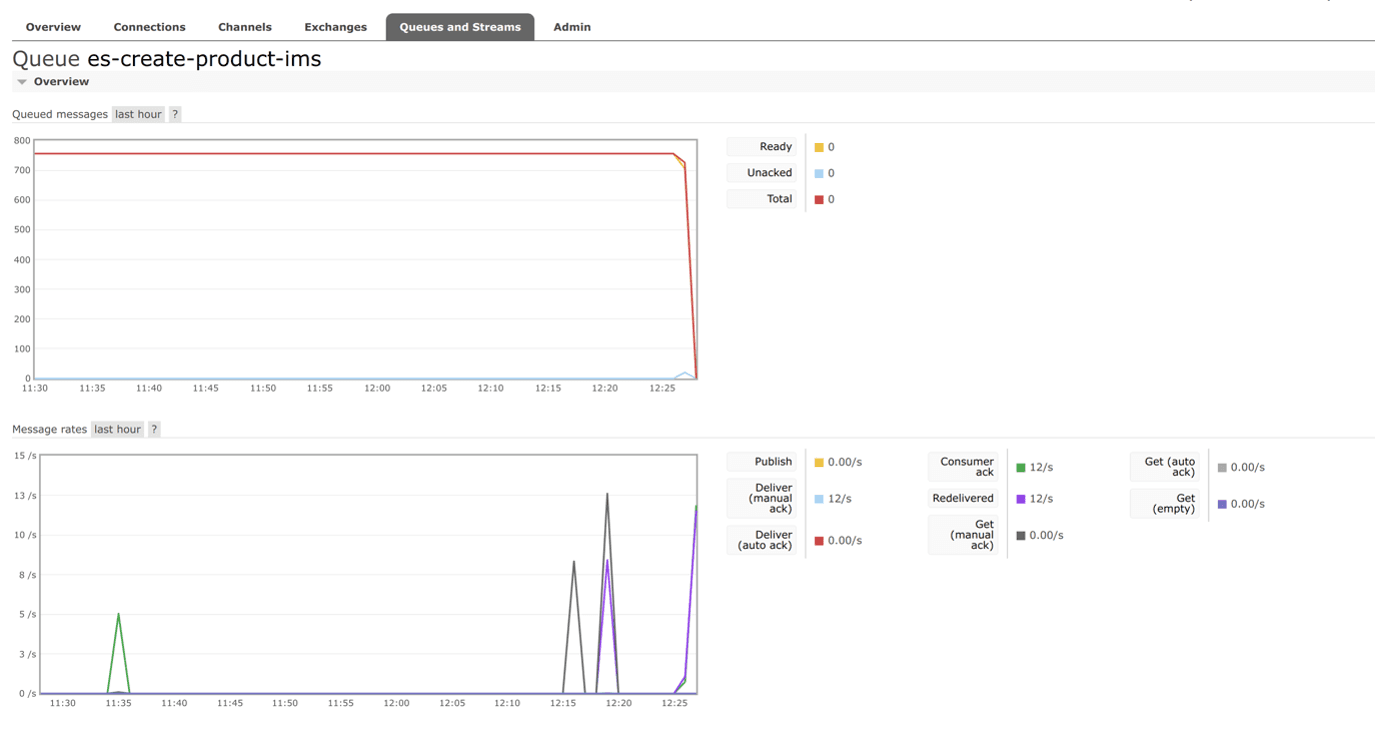
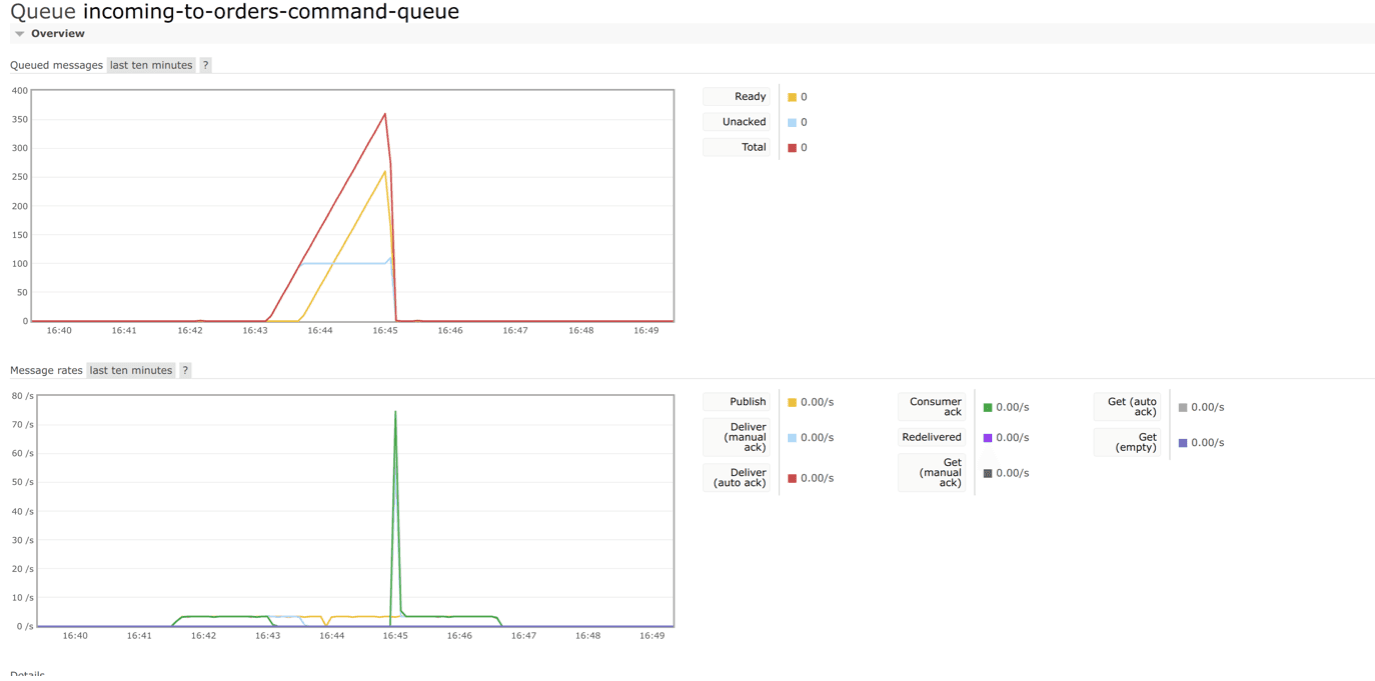
The queue of commands that actuate the step-executor started to grow, but after the restart, all the messages were processed:
Conclusions
The service was stopped precisely between the consecutive starts of this execution step (triggered at 1-second intervals), and the commands for subsequent starts began to queue up.
The lack of redelivery via rabbit-mq indicates that the operation was not interrupted and the command triggering the step-executor did not return to the queue.
Step-executor shutdown
Overview
Gracefull stoppage of the IMS(Inventory Management System) step-executor (kubectl scale –replicas=0) from 15:20:50 to 15:21:30.
Purpose
Simulation of system behavior during planned unavailability of a step executor.
Result
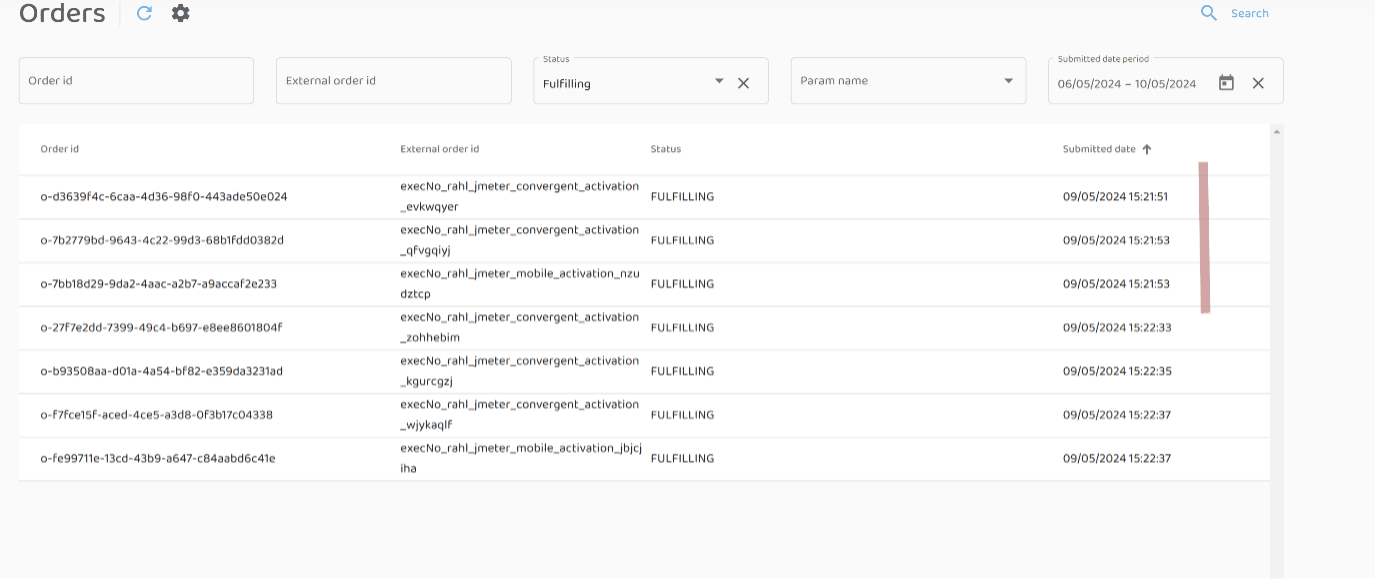
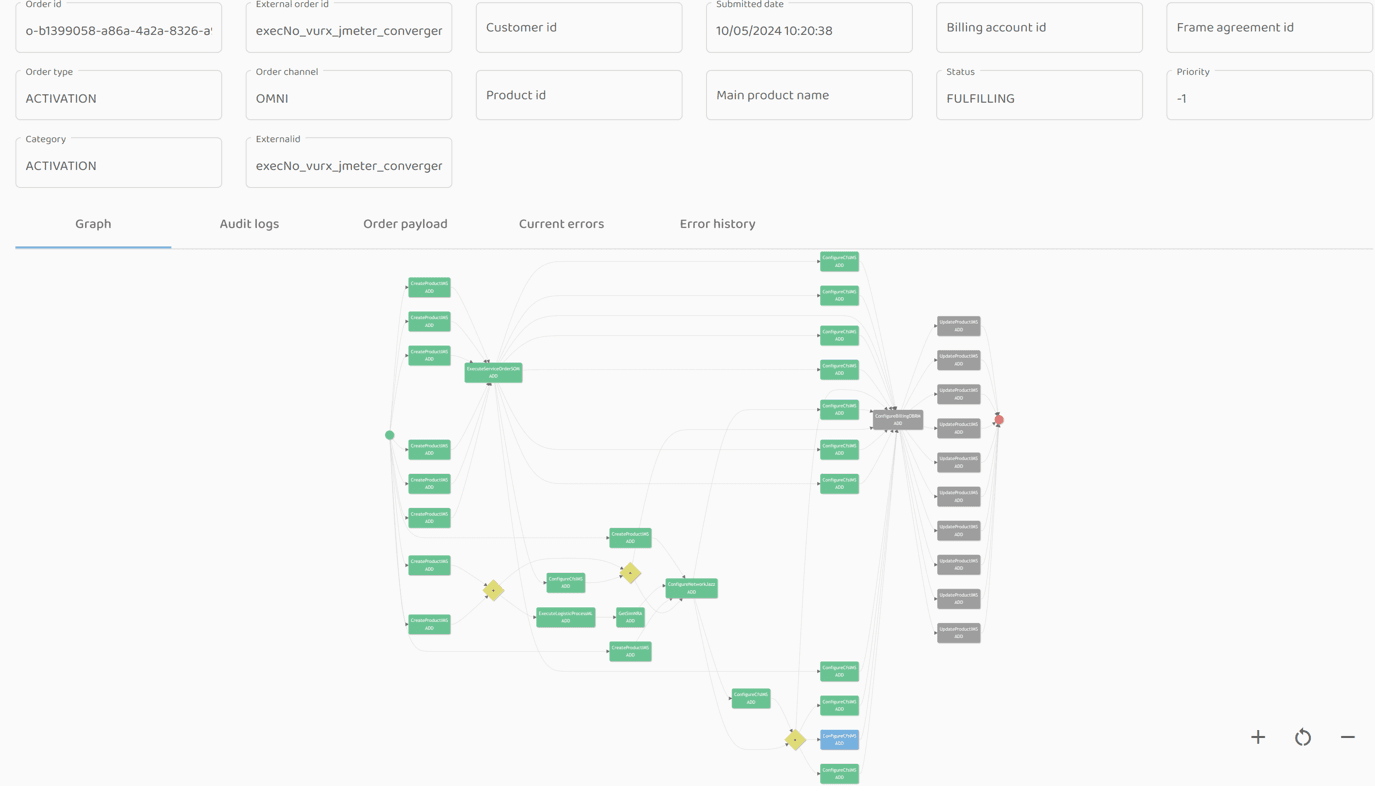
3 orders stuck at various steps of fulfillment process:
The asset was created, but the callback did not return to COM:
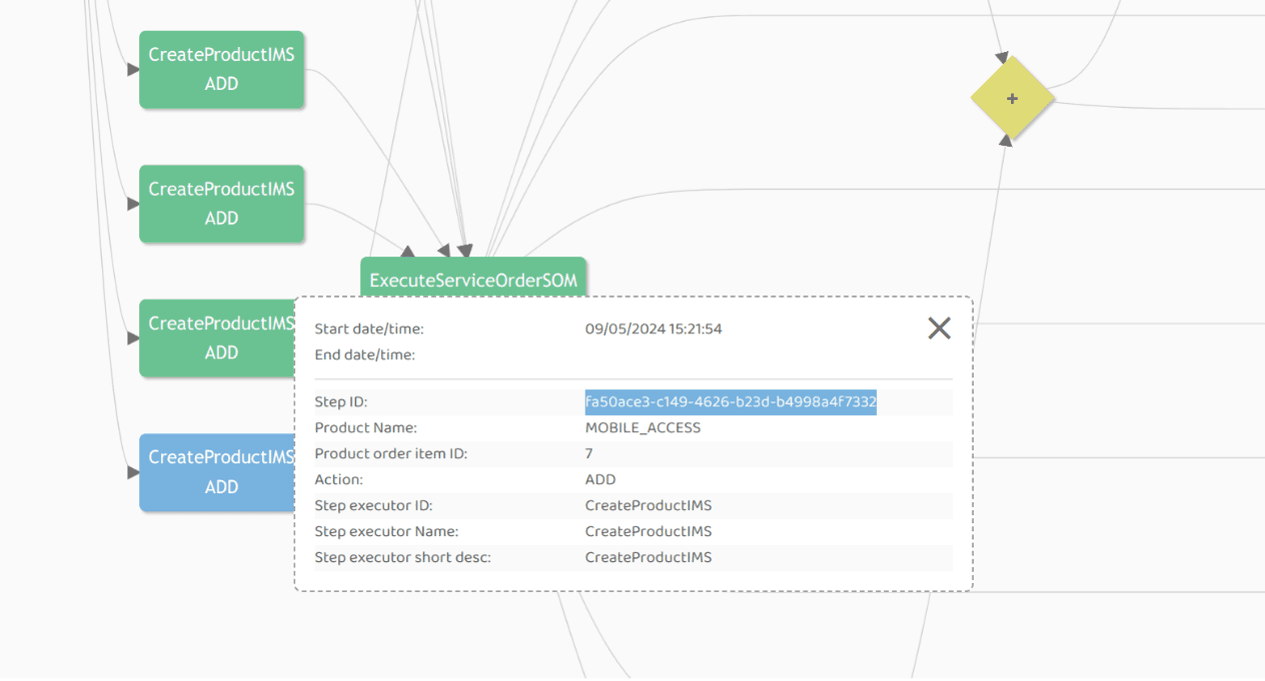
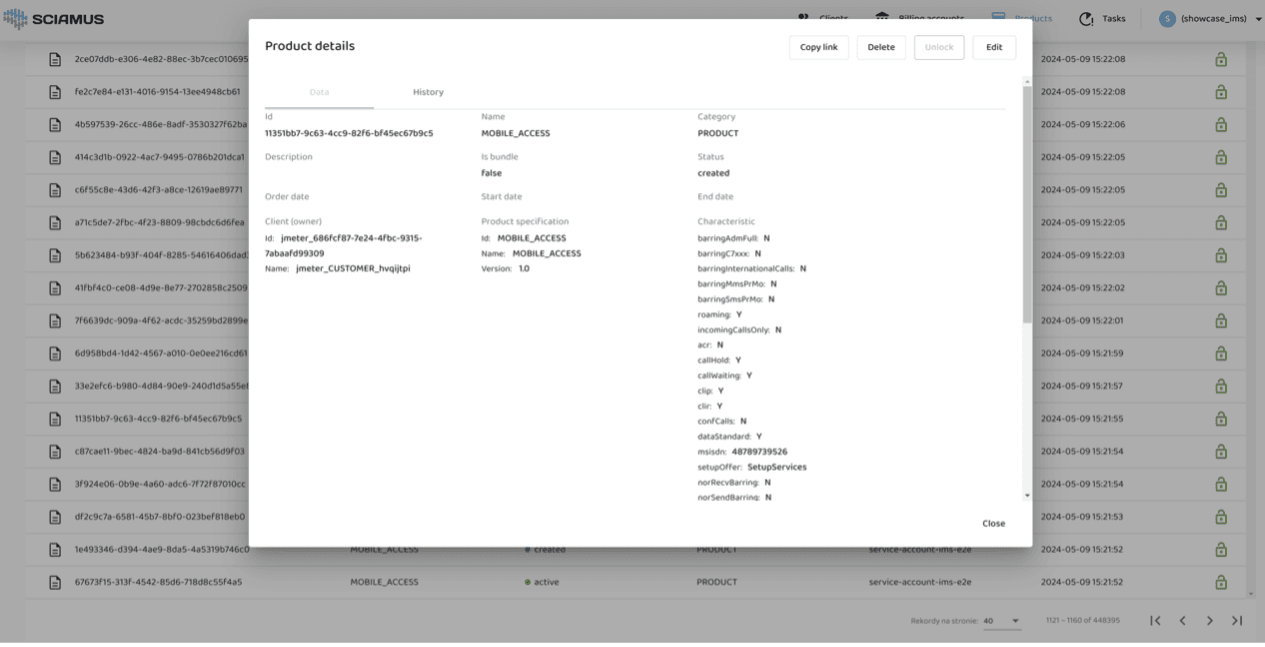
Despite the callback not being successfully executed, the asset was saved in IMS:
Execution-step Configure CFS x2 (ID: o-7bb18d29-9da2-4aac-a2b7-a9accaf2e233):
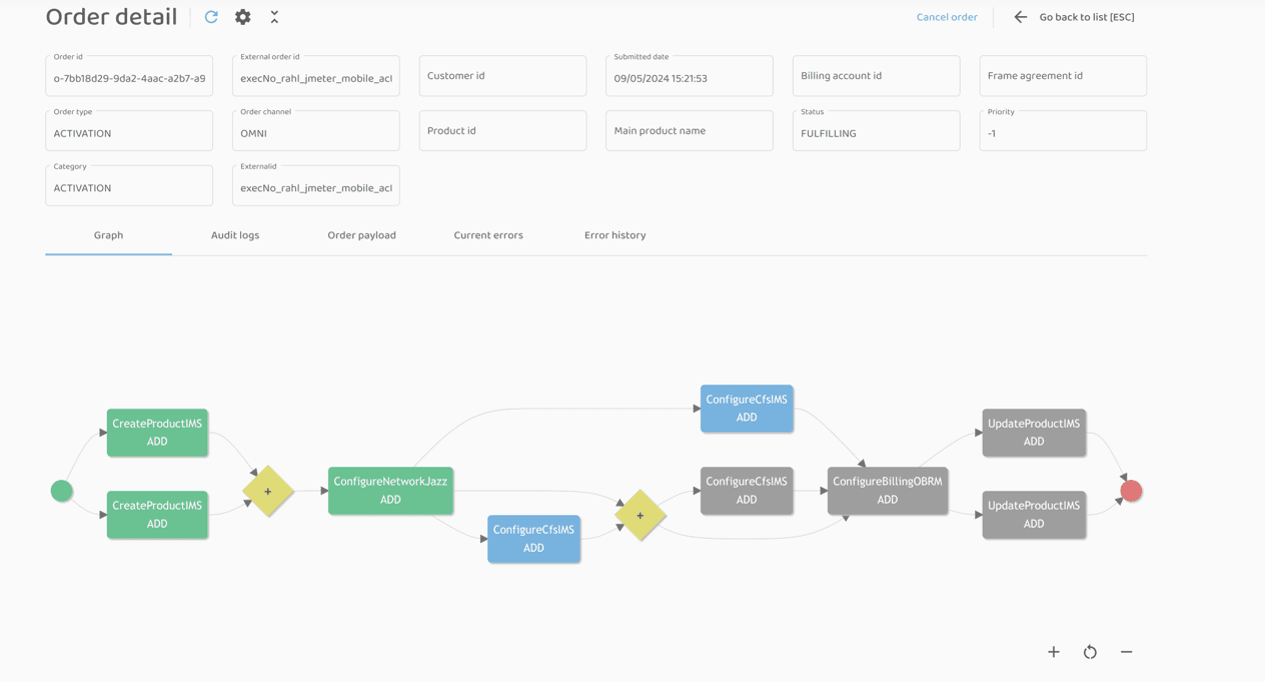
Configure CFS x1 (ID: o-d3639f4c-6caa-4d36-98f0-443ade50e024):
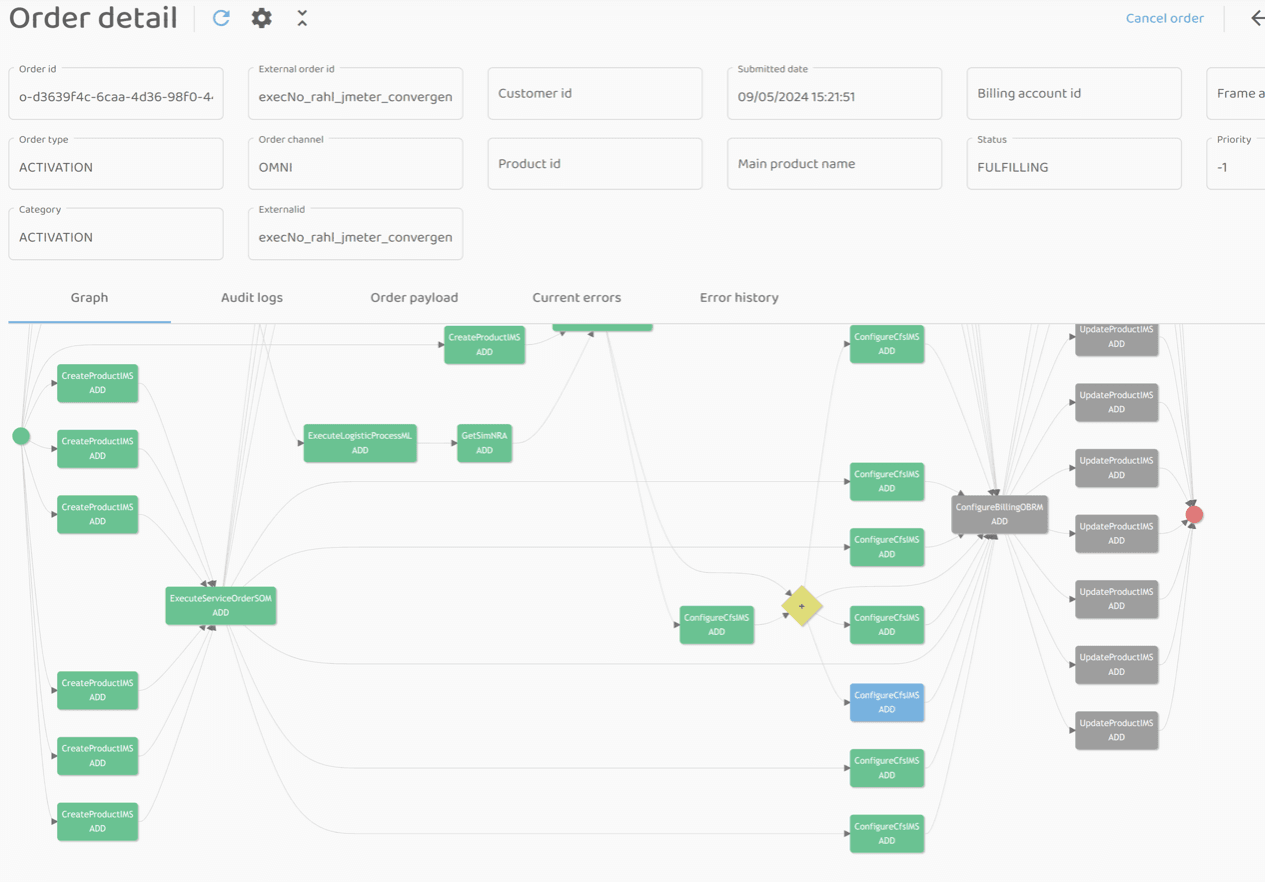
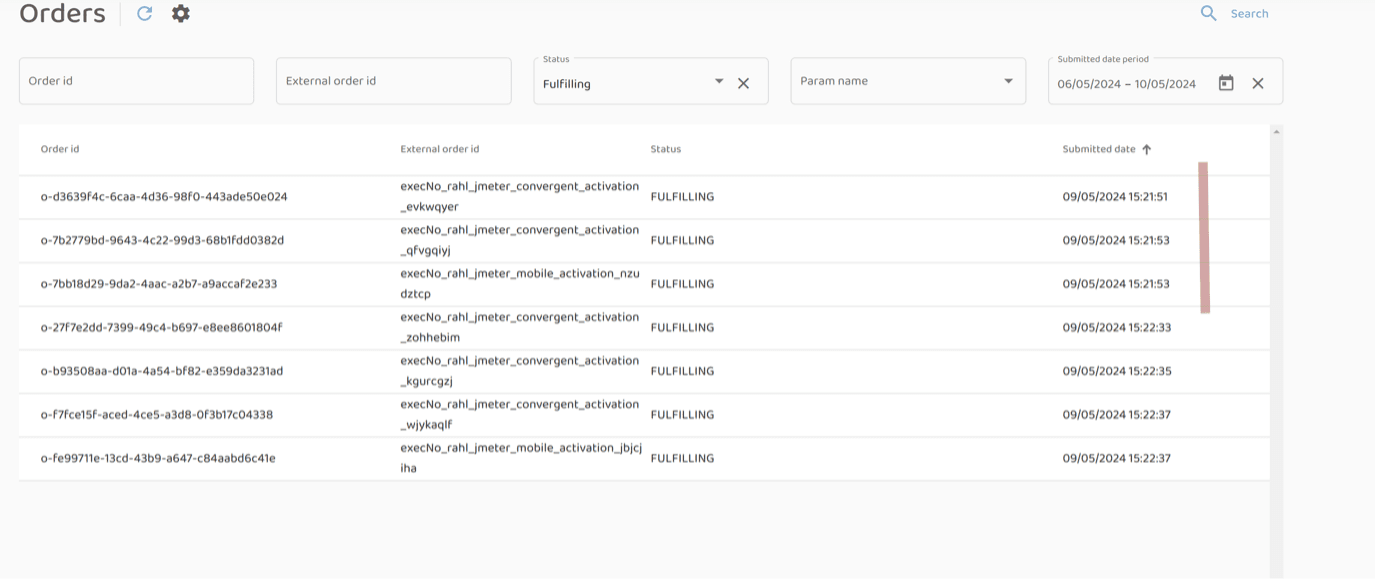
Observation of the dashboard indicates that the orders are stuck in the FULFILLING status (i.e., the fulfillment of the order was not completed):
Conclusions
To verify the final result of the test, the IMS system state should be checked and actions should be appropriately compensated as follows:
- Manual correction of the payload and skipping the step.
- Repeating the step to recreate the product and remove the old, unused asset.
- Potential fixes on the IMS side: retrying the callback or adding DLQ to the callback queue.
Step-executor recurring failure
Overview
Three sudden stoppages of the IMS step-executor, followed by scaling the step-executor down to zero (kill 1: 10:20:40, kill 2: 10:22:08, kill 3 + scale down: 10:22:59): (kubectl delete -now) + scale down.
Purpose
Simulation of system behavior when it suddenly stops functioning and the administrator decides to restart it (e.g., after a failed deployment).
Result
The mock reported errors about not being able to send callback during the unavailability of the IMS step-executor.
After restarting the IMS step-executor, commands from the queue began to create assets, but the callbacks arrived too quickly, causing errors.
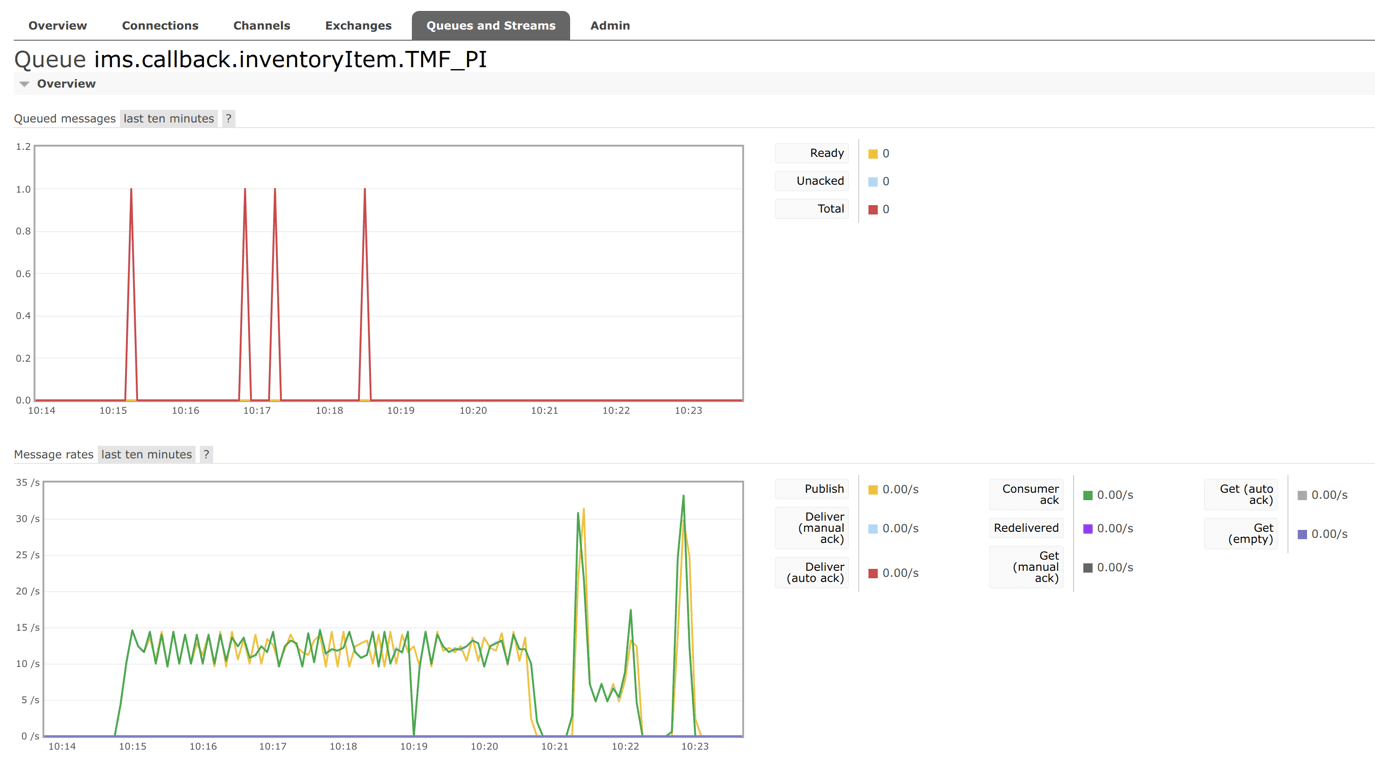
No messages were observed to be stuck in the queue of commands actuating the IMS step-executor.
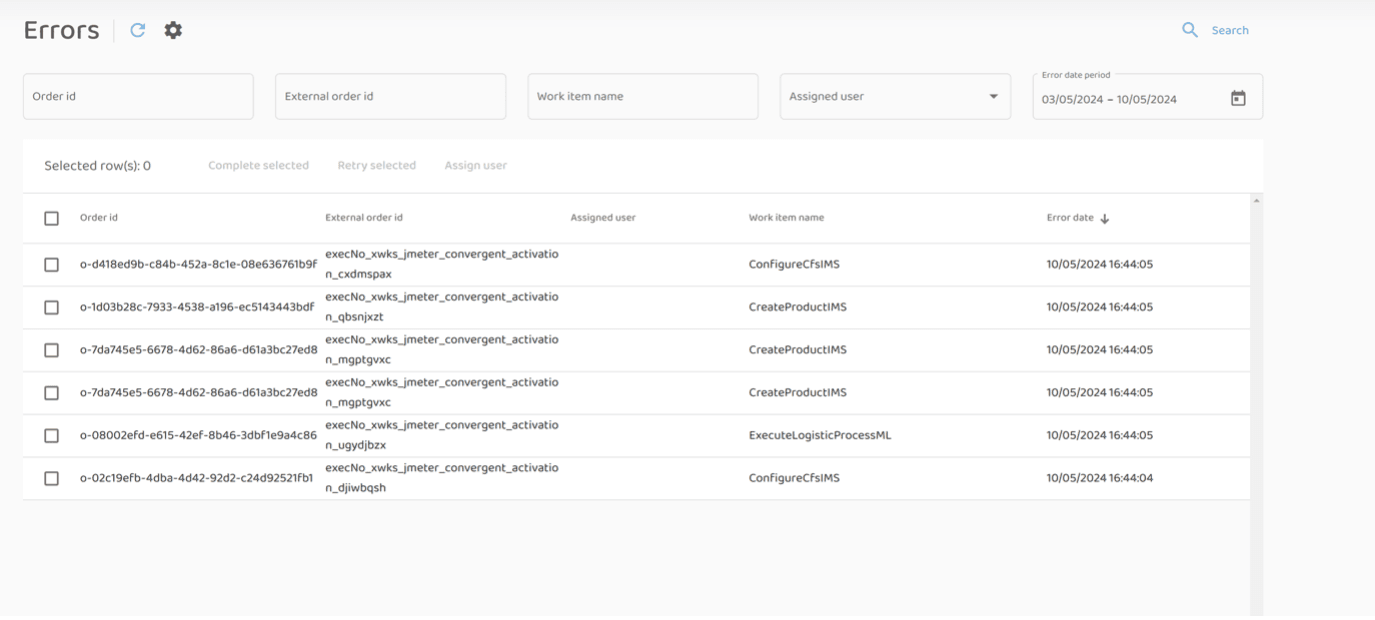
Screenshot from the queue commissioning the execution of callbacks that were supposed to inform about the creation of a new asset:
Order stuck at the ConfigureCFS execution step because the step-executor did not receive the callback:
Callback sending started (highlighted TraceID):
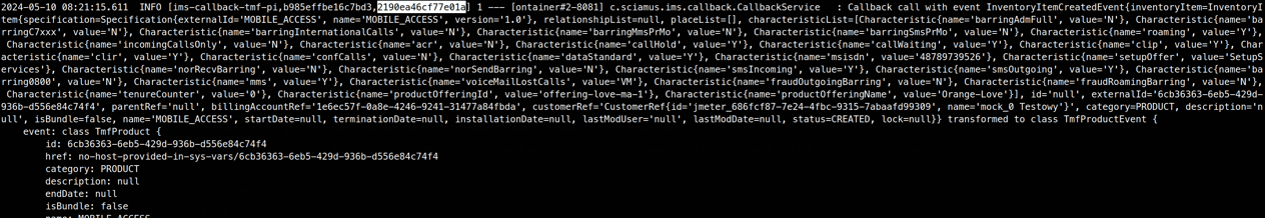
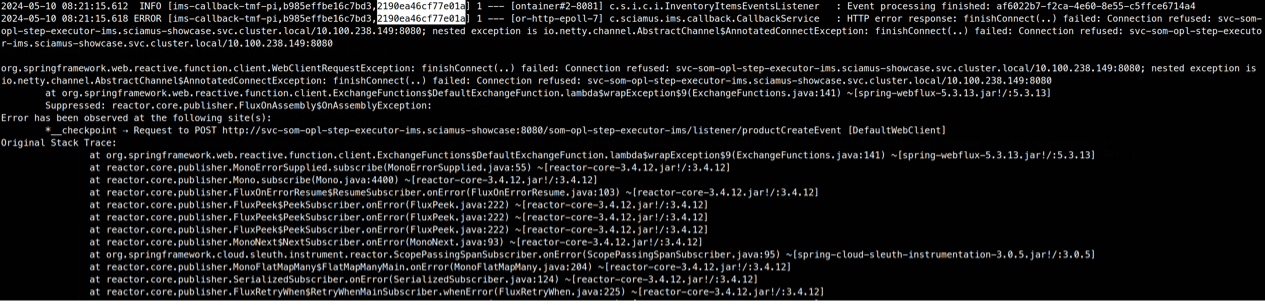
Callback sending ended with Connection Refused error (same TraceID):
The IMS step-executor was brought back to life after an hour, after which it immediately processed the pending execution-step start commands:
Restarting the IMS step-executor resulted in the consumption of all pending execution-step start commands that accumulated during the service’s unavailability.
At the same time, after the SE restart, IMS was not yet ready to accept incoming traffic, which caused the rejection of callbacks.
Potential fix: the IMS step-executor should wait for its HTTP server (listening for callbacks) to start before beginning to execute start commands from the RabbitMQ queue - this needs to be corrected on the step-executor side.
Expected behavior: readiness for communication using HTTP should be simultaneous with readiness for communication via RabbitMQ.
Introduction of consistent mechanisms to compensate for callback errors (e.g., retry policy, DLQ, monitoring, or others) can also mitigate the above problem.
RabbitMQ failure
Overview
Stopping and restarting RabbitMQ according to the following specification:
- Test start (beginning of jmeter operation): 13:28:20
- RabbitMQ stop: 13:30:43
- Sending rate: 200 orders/min
- Stopping was done by suspending RabbitMQ communication with consumers, i.e.:
- rabbitmqctl suspend_listeners
- rabbitmqctl close_all_connections --vhost / "Closed by request"
- Resuming RabbitMQ operation: 13:32:56 (time of the last error reported by the incoming-orders service)
- Test end: 13:33:20
Purpose
Simulation of system behavior during a major infrastructure failure.
Result
1001 orders were sent, 557 were received, 13 orders got stuck in the FULFILLING status, completed orders: 544 (status COMPLETED). Performance report is attached below.
Incorrect orders are present – the system did not accept them as they could not be saved in the input buffer queue.
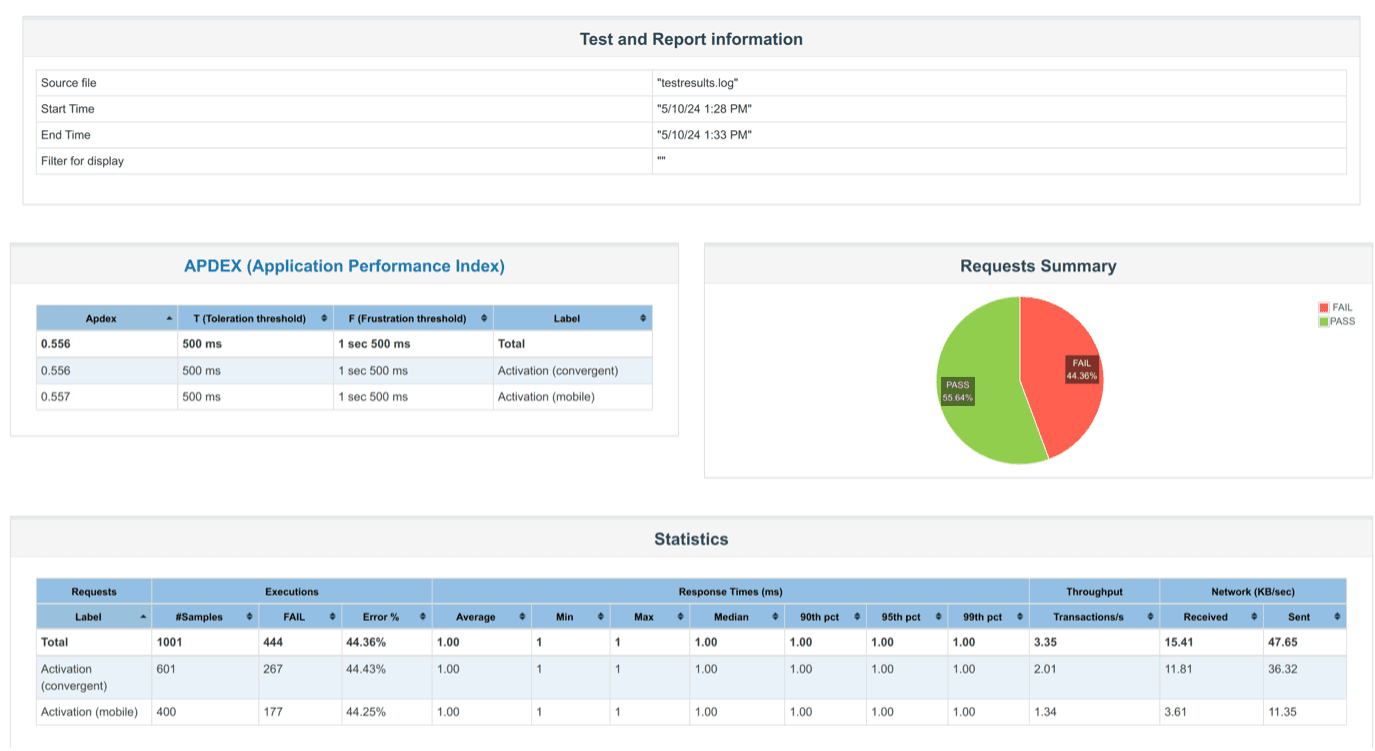
All orders accepted by the incoming-orders service were recorded in the system as orders visible from the GUI.
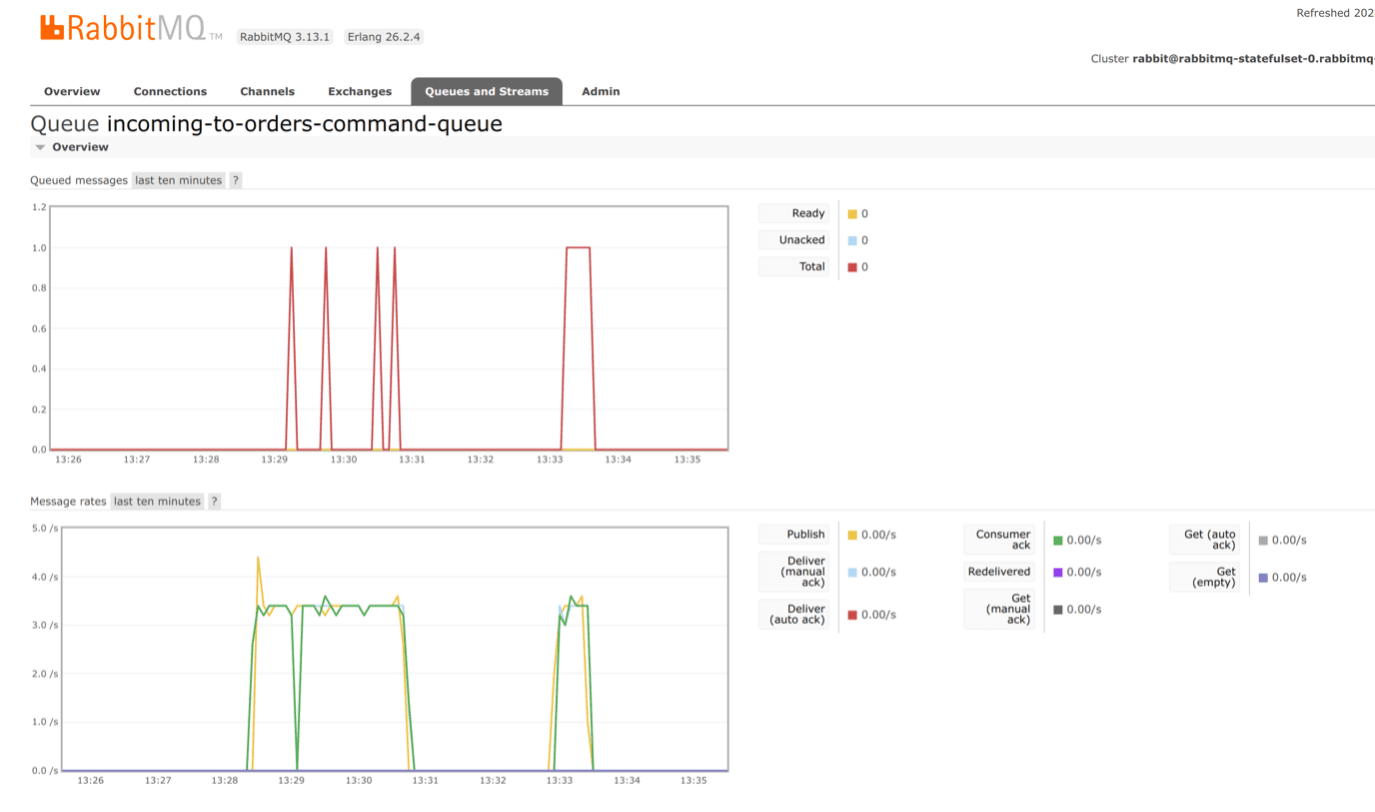
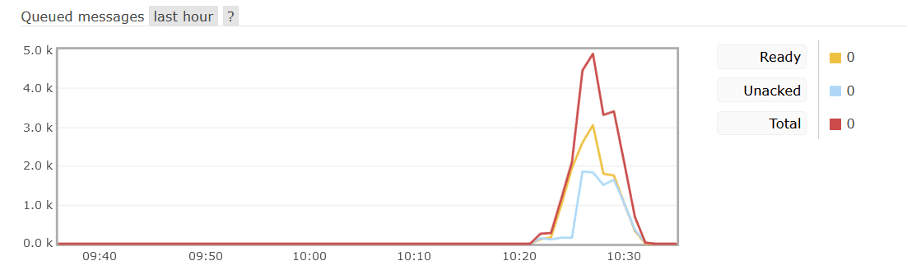
Screenshot depicting the incoming-to-orders queue — a queue using the publisher-confirms mechanism to ensure data write guarantees in case of failure. This mechanism ensures that the acknowledgment of receipt of the message arrives only after obtaining a guarantee that the message has been successfully delivered or persisted:
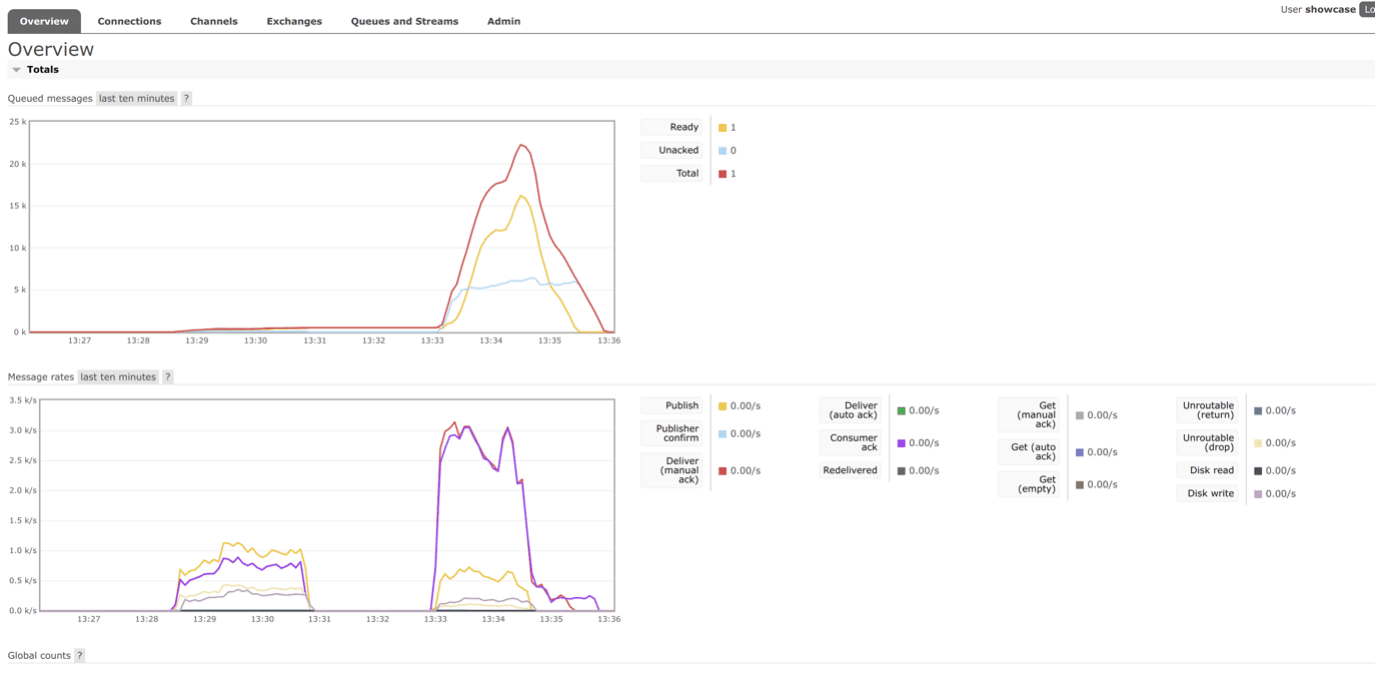
Overview of all queues:
Conclusions
Operations requiring synchronous communication through RabbitMQ (e.g., updating orders) are sensitive to infrastructure unavailability.
Orders that did not require synchronous communication patiently waited for the restoration of service connections to RabbitMQ.
Due to infrastructure availability interruptions, it was not possible to process HTTP requests coming to the IMS step-executor as a result of a callback (the execution step could not be completed). Repeating the step for ConfigureCFS resulted in the creation of another process on the step-executor side (with a different ID).
Services that lost connections to the message broker automatically regained them after its availability was restored. No service restarts were required.
MongoDB failure
Overview
Simulation of the sudden stoppage and restart of MongoDB (permissions for connections to all services were removed via the MongoAtlas admin panel, and then restored after a moment).
Purpose
Simulation of system behavior during a major infrastructure failure.
Results
- Test duration: 16:41:35 - 16:46:30
- MongoDB unavailability: 16:43:00 - 16:44:15
- Sending rate: 200 orders/min
- During the test period, 1001 orders were sent. The test concluded with the following results:
- Completed: 996
- Fulfilling: 5 (current errors: 6)
- Messages appeared in the DLQ as a result of write/read errors during processing in the core elements.
- Entries related to processing errors due to database unavailability appeared in the fulfillment error collection. Since the database is directly controlled by either core services or step-executors, the errors are handled in a standard way and end up in a separate error handling domain.
Reported error cases had one of two causes:
- Timeout exception during order update - stalled transaction
- Timeout exception during order fetching
The input queue (order-capture) during the unavailability of consumers on the core order service side began to queue incoming orders. After the bringing MongoDB back to operation they were processed at a very rapid pace.
Conclusions
- Execution step start commands were not lost.
- No observations were made that the fulfillment service started sending messages to the DLQ.
- The unavailability of the MongoDB database causes the suspension of order processing by services using it. This results from the blocking of threads waiting to obtain a connection to the database.
- Threads started at the moment of database access interruption end with a write or read error or, in the case of core services, are rolled back to the queue and processed again.
- Services that lost connections to the database automatically regained them after its availability was restored. No service restarts were required.
K8s cluster node failure
Overview
- Number of nodes (EC2) in the cluster: 4
- Setting the number of service pod replicas to two (2)
- Running the performance test (traffic rate: 200 req/min, duration: 5 min)
- Stopping the EC2 machine - terminate command
- Auto Scaling Group (EKS configuration) creates a new EC2 instance after detecting the node stop in the cluster
Purpose
Simulate node failure by terminating it and triggering the cluster auto-scaling mechanism.
Result
- Number of replicas: 2 pods each
- Test: 200/min - 5min disaster-recovery-infra.jmx
- Queue state: all empty
- Database state: empty
- Test start: 10:20:30
- Node kill: 10:21:00
- Pod termination start: 10:21:50
- Test stop: 10:25:26
- Queue discharge time after test completion: 10:31:00
Order main statuses count
| Status | Count |
|---|---|
| Completed | 893 |
| Error | 0 |
| Fulfilling | 24 |
Other order statuses count
| Status | Count |
|---|---|
| CREATED | 1 |
| PREPROCESSING | 1 |
| VALIDATING | 2 |
| PLAN BUILDING | 1 |
Error types & count
| Step | Error | Count |
|---|---|---|
| ConfigureCfsIMS | Connection timed out executing POST request | 4 |
| WriteConflict to MongoDB | 1 | |
| CreateProductIMS | Connection timed out executing POST request | 6 |
| WriteConflict to MongoDB | 1 | |
| UpdateProductIMS | WriteConflict to MongoDB | 6 |
| Unexpected end of file from server | 1 | |
| Connection timed out executing PUT request | 1 |
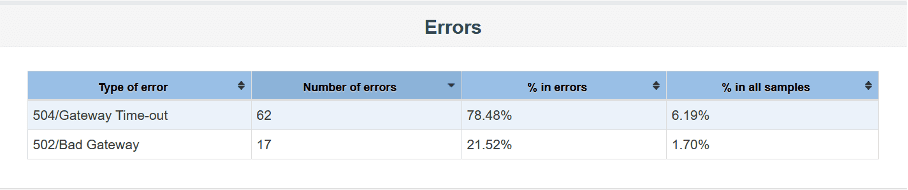
Description of rejected orders (not accepted by the system) and potential reasons

Conclusions
- The cluster auto-scaling mechanism initiated a new instance after detecting the node failure
- The response and full availability restoration time of the cluster was approximately 3 minutes
- Pods that were not affected by the failure continued standard processing
- Newly created pods took over processing
- Pods that failed introduced typical errors resulting from unavailability, e.g., timeout, end of file. These errors are repairable from the CDOM or administration console